SAP Analytics Cloud like any Planning and Reporting tool has some of the same asks and requirements as other SAP legacy tools and competitor products. I’ve been fortunate to be in the Planning-space with SAP for over a decade with a good chunk of that in the Consulting and Services space.
What I’ve found is that despite many business trends emerging and surface level requirements changing there are foundational and timeless needs that all businesses will continue to have. What I’d like to walkthrough in this blog post is one of these basic business requirements and how native SAP Analytics Cloud capabilities can address these.
One of our tried-and-true basic reporting requirements in any Planning or Analytics solution continues to be Comparative or Variance reporting. Regardless of being purely Planning, purely Analytics related or if it's a combination of both. but rather could be a combination of both. This also transcends any pure Finance-driven function, at the end of the day any LoB or Function calls for the same requirement. Simply put, I have a Version, actual/budget/forecast/plan for revenues/expenses/production/demand and would like to compare against another Version (fill in the underlined as the base requirement remains unchanged).
Now, how do we create a report in SAP Analytics Cloud that allows a user to dynamically select the Time-periods and Versions to compare against?
In this How-To I'll walk through a scenario where you would like a user to select a version and time period in ‘column A’ to another user selection to select a version and time period in ‘column B’. The use of Story or Group filters typically override user selections (via Page Filters) and render this scenario null.
First, you'll need to add Cross Calculations into your column definition (in my scenario, I've renamed mine into Story Calculations).
Next, you will need to create two ‘Restricted Measures such as:

Restricted Measure Example (click image to expand)
The underlined red dimensions relate to the ‘user selections’ which refer to the input controls:

Corresponding User Input Controls (click image to expand)
The underlined green ‘enable constant selection’ can be used IF a Story/Group filter is used for these dimensions (e.g. Time) and you would like the user selection to override it. For example, if a user selects 2020 for other widgets (tables and charts) on the Story tab (via a Story filter), however, for this table you would like to select 2019, you would select this and enable constant selection for Time.
The defined Restricted Measures would then be placed in the Columns as calculations:

Table Definition (click image to expand)
And the final result would be the following table being driven based off of user selections for ‘comparison versions/time’ in a column over column fashion:
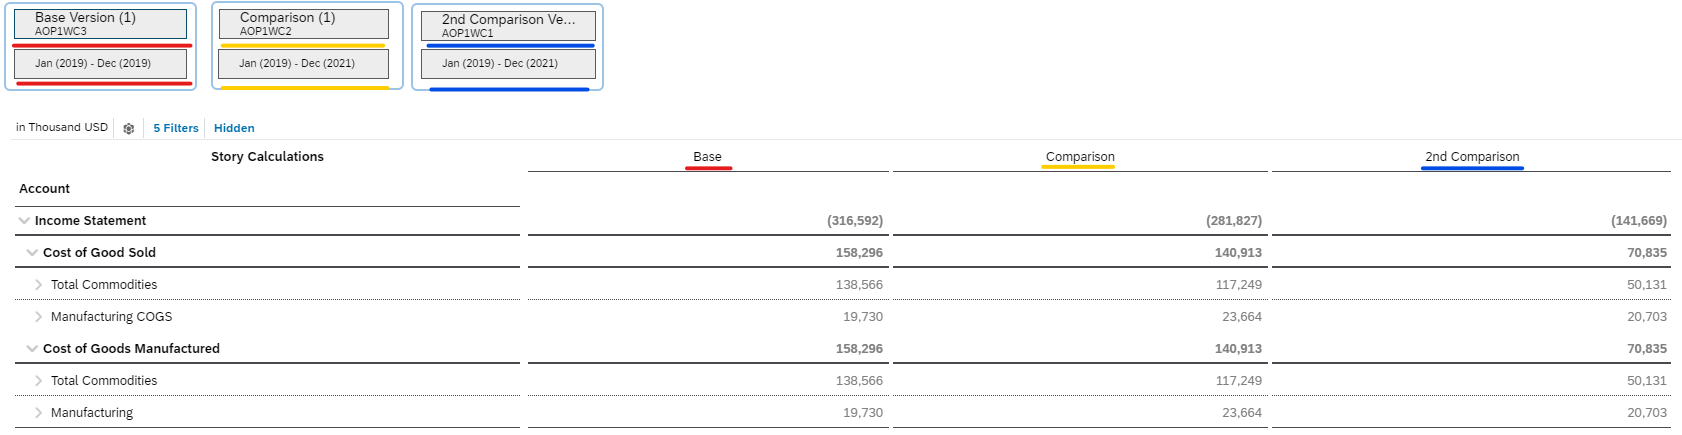
Final Table Result (click image to expand)
In the blog post found here please see how to allow a user to perform Version over Version comparati...
This concludes our How-To, I hope you have found this blog post useful as I feel it’s important to understand some of the foundational pieces of SAP Analytics Cloud when it comes to planning and reporting.
As we progress into the new year I will continue writing on a host of topics as it pertains to SAP Analytics Cloud. My goal will be to continue to provide my experiences with creating various solutions to business problems and customer requirements. The underlying theme for these solutions will be focusing on best practices and where creativity is necessitated still having an eye on sustainability.
Thank-you and stay tuned for subsequent blog posts.
