

- SAP Community
- Products and Technology
- Technology
- Technology Blogs by SAP
- Predictive Planning: Forecasting US National Park ...
Technology Blogs by SAP
Learn how to extend and personalize SAP applications. Follow the SAP technology blog for insights into SAP BTP, ABAP, SAP Analytics Cloud, SAP HANA, and more.
Turn on suggestions
Auto-suggest helps you quickly narrow down your search results by suggesting possible matches as you type.
Showing results for
Product and Topic Expert
Options
- Subscribe to RSS Feed
- Mark as New
- Mark as Read
- Bookmark
- Subscribe
- Printer Friendly Page
- Report Inappropriate Content
12-22-2020
5:45 PM
Introduction
Year 2020 is coming to an end, it was special in so many ways. I thought I would conclude the year with a Predictive Planning blog 😉
Kudos to my colleague david.stocker for inspiring me on this topic. David is a huge fan of US National Parks, in particular Zion National Park , a nature gem! On a side-note I would love to pay this park a visit one day.
The US National Park Service has a website named NPS Stats. It is well maintained and full of interesting statistics. You can use it to create your own Predictive Planning scenarios.
From this site, I created a data file. It contains the monthly recreation visits for the 82 US National Parks. The data starts for most of the parks back in January 1979 and stops at end of 2019. This is a true data treasure.
You can find the data file here if you want to recreate this example.
Creating the Planning Model
Predictive Planning speeds up and guides the planning activities in SAP Analytics Cloud. Predictive Planning forecasts the evolution of key indicators over time. It runs on top of planning models.
To create the planning model I have two options:
- I can create the planning model directly from my data source
- I can also create a dataset from my data source then create the planning model on top of the dataset.
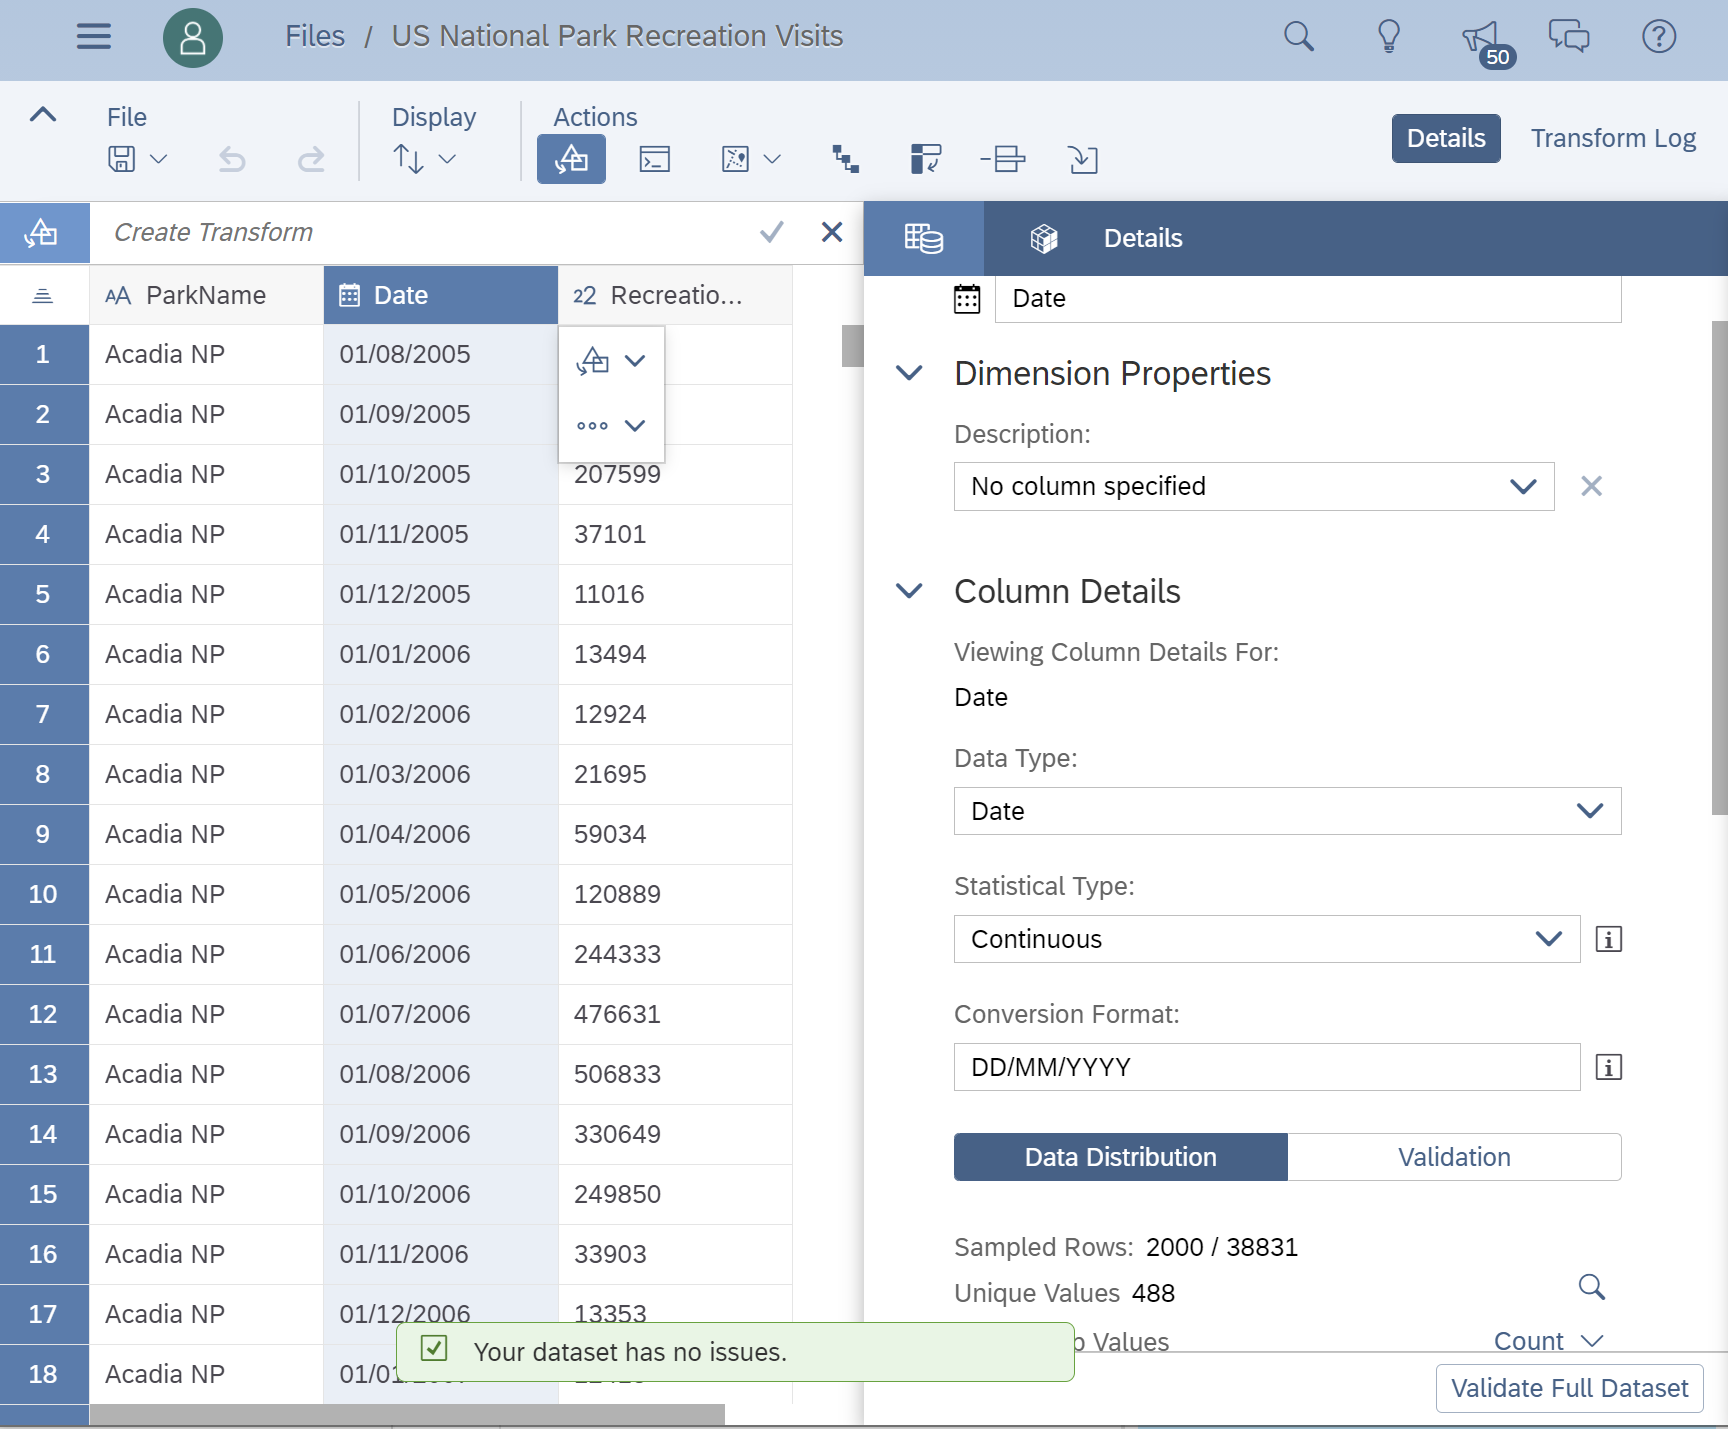
I choose the second option, and create a dataset first. SAP Analytics Cloud picks the correct date format for me, and the dataset is all fine. Good!
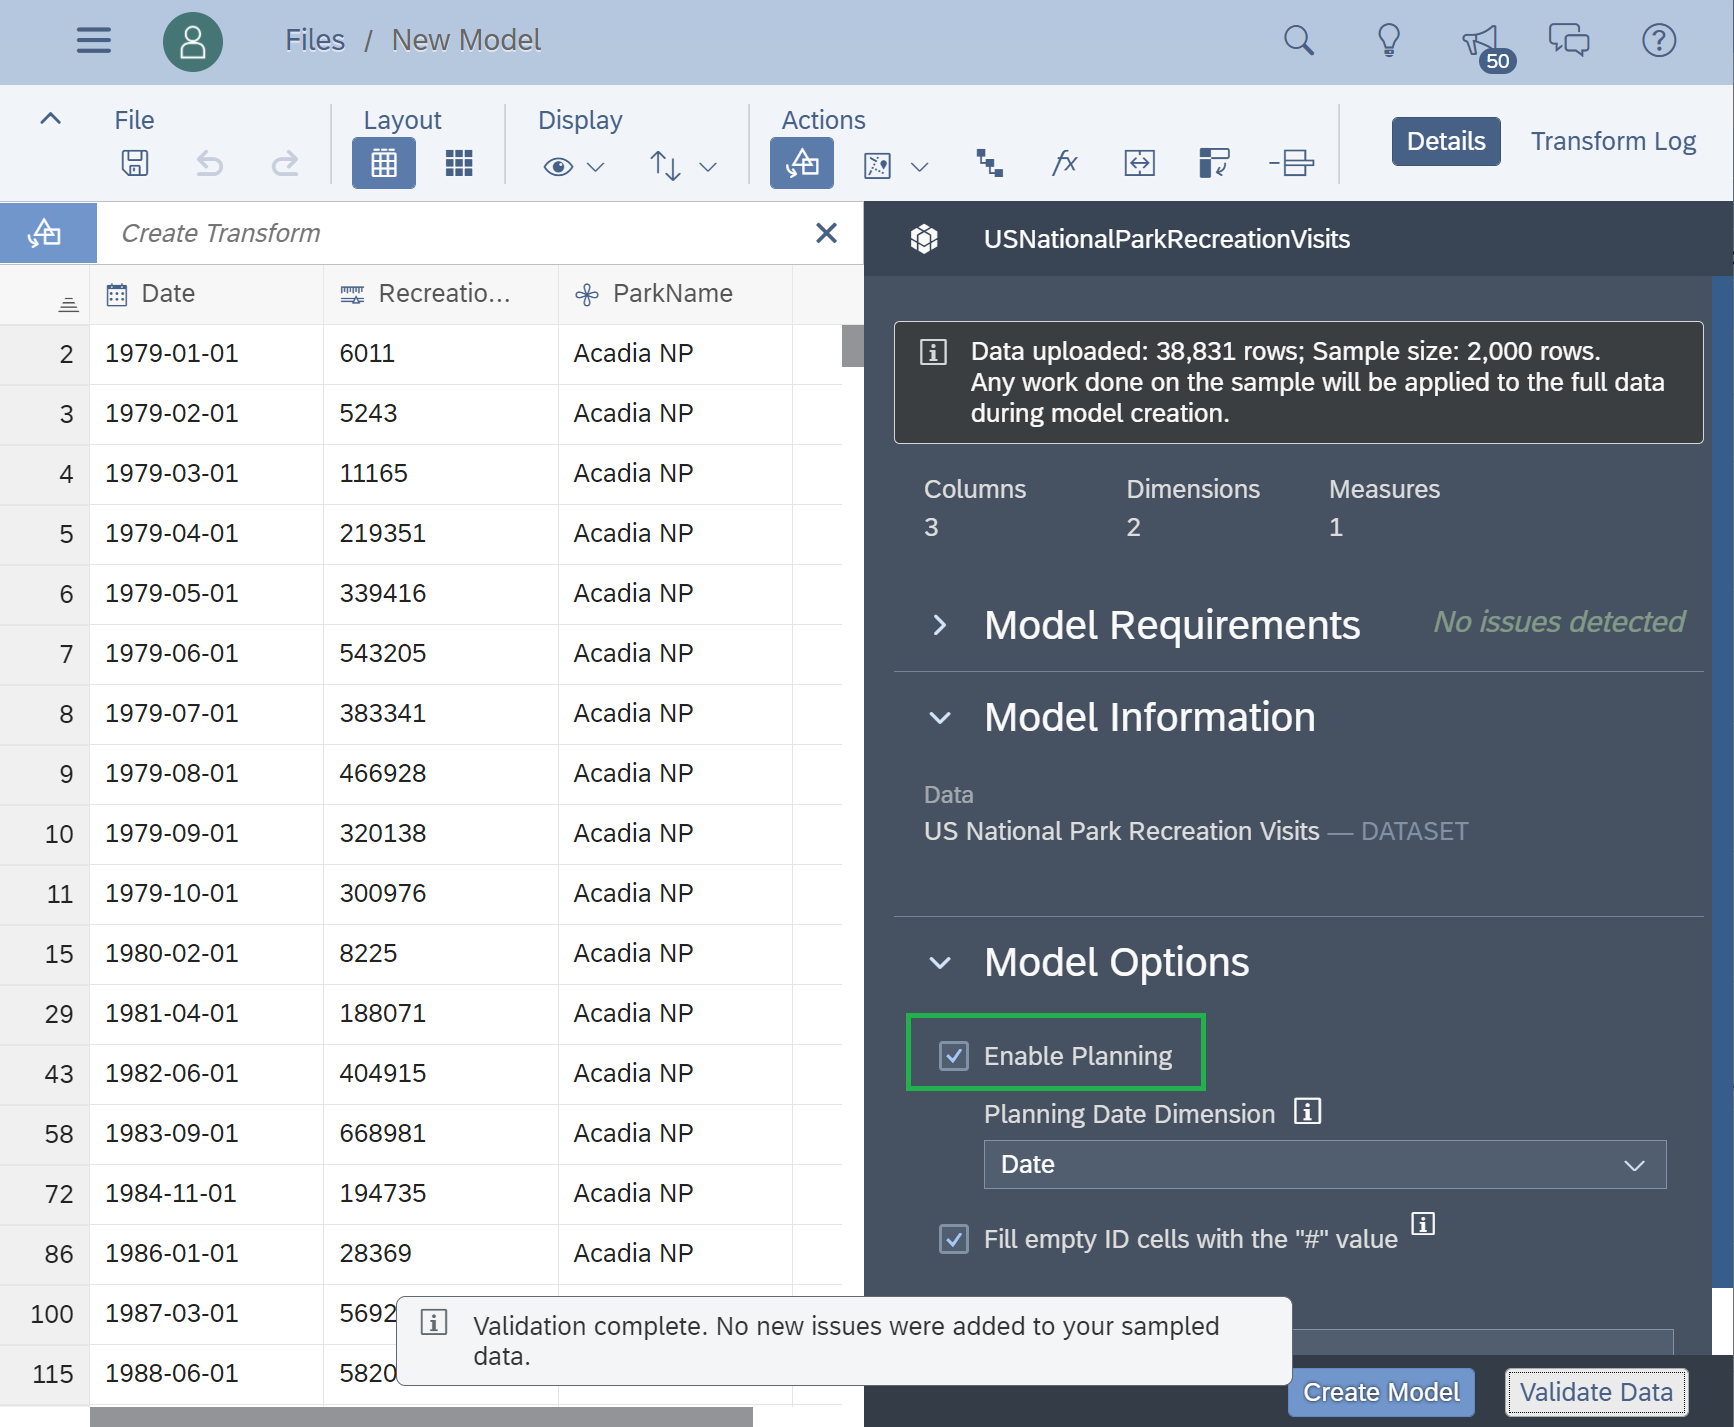
Then I create the planning model from the dataset. Again it's a straightforward process. I select the dataset as a source for my planning model. The only think I need to remember is to check the Enable Planning checkbox to make sure my model is a planning one.
In very few clicks I am ready with a solid data foundation. Let's predict!
Comparing 2019 Actuals and Predictions
In a first step, I will reserve the twelve months of 2019. By this I mean that the data that I will use to create my predictive model will stop at the end of 2018. The 2019 data will not be visible or known by the predictive model.
I know the number of visits (actuals) that the different parks received in 2019. I want to confirm that the predictive approach provides benefit for my planning. Indeed the increase visitor affluence in the parks proved to be a challenge in the past years.
Predictive Planning is very flexible to the way I can approach predictions. I can actually predict with numbers aggregated at national level. I can also predict the evolution at park level then roll up the predictive forecasts to get national numbers. I will compare the two approaches.
Predicting 2019 Visits at National Level
I create a predictive scenario, of type time series.
Below are the settings:
- The data source is the planning model, and the Actual version.
- The value to forecast is the RecreationVisits.
- The number of forecasts is 12, for January 2019 to December 2019.
- I use the past 60 months of data - so January 2014 to December 2018.
- It does not make sense to have negative visits, so I want only positive forecasts.

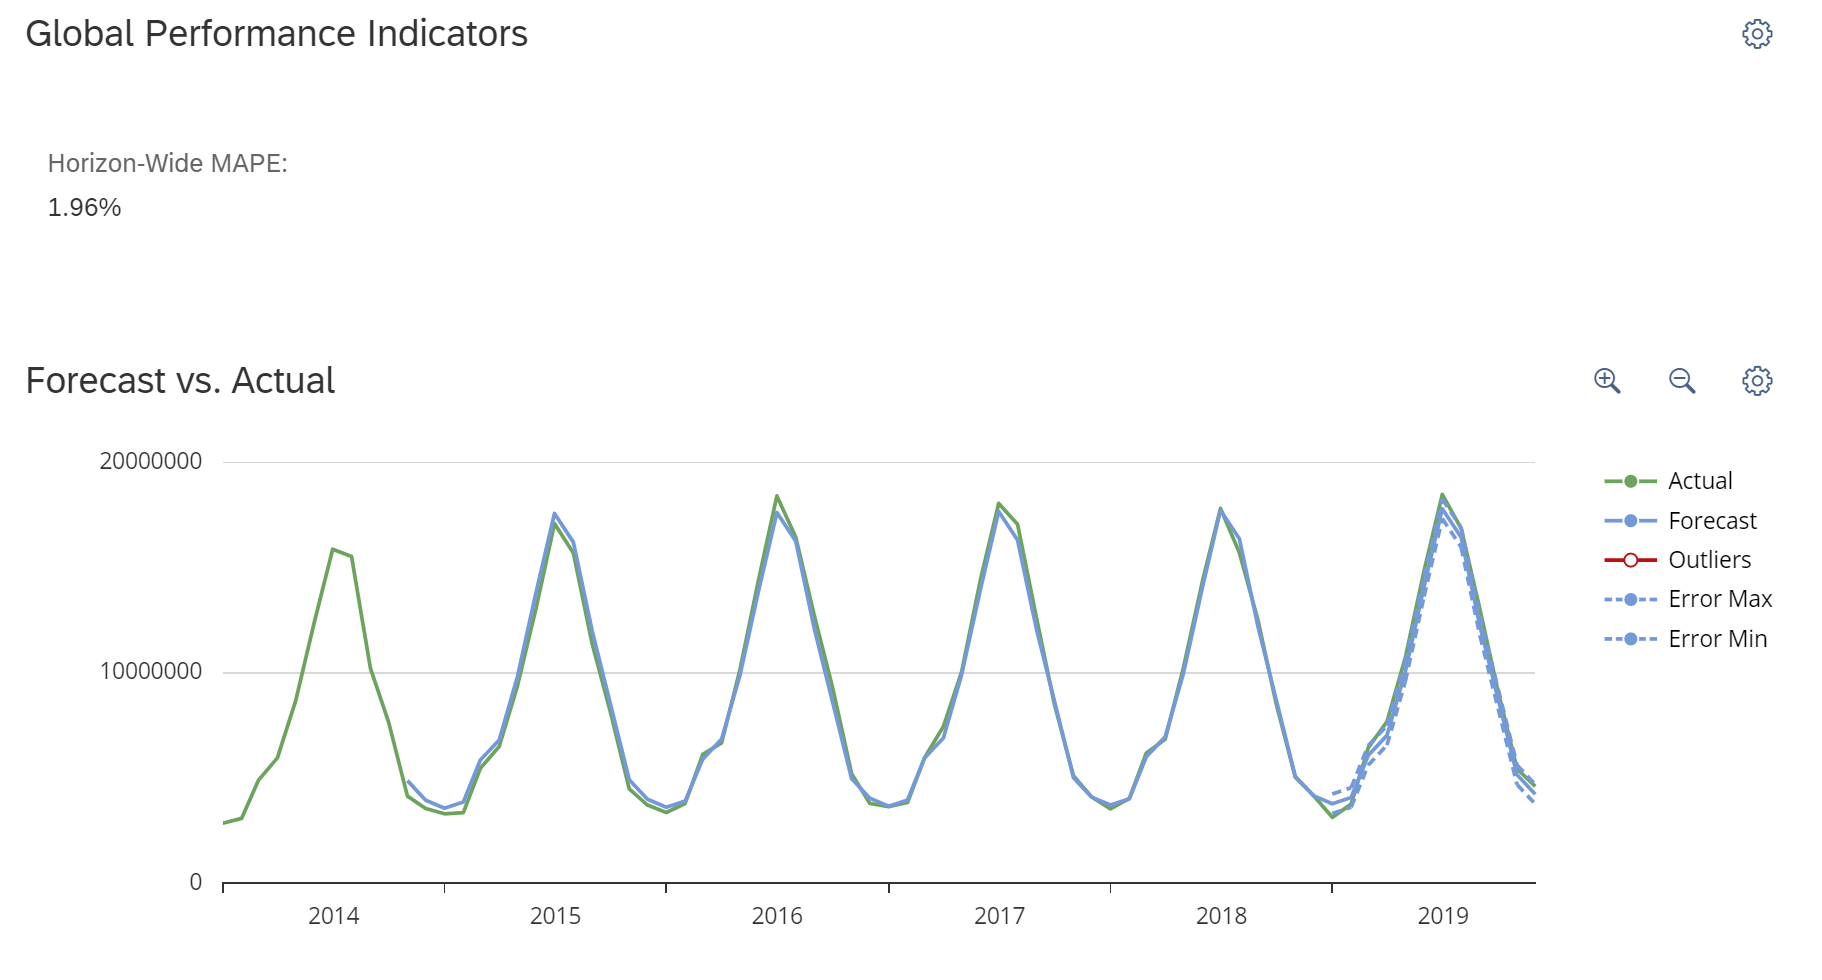
The predictive model is accurate. It has a Horizon-Wide MAPE of less than 2%, which gives me a way to estimate the error that the model is likely to commit. We can notice that the visits are very cyclical, they do peak in July and August and decrease in the winter season.
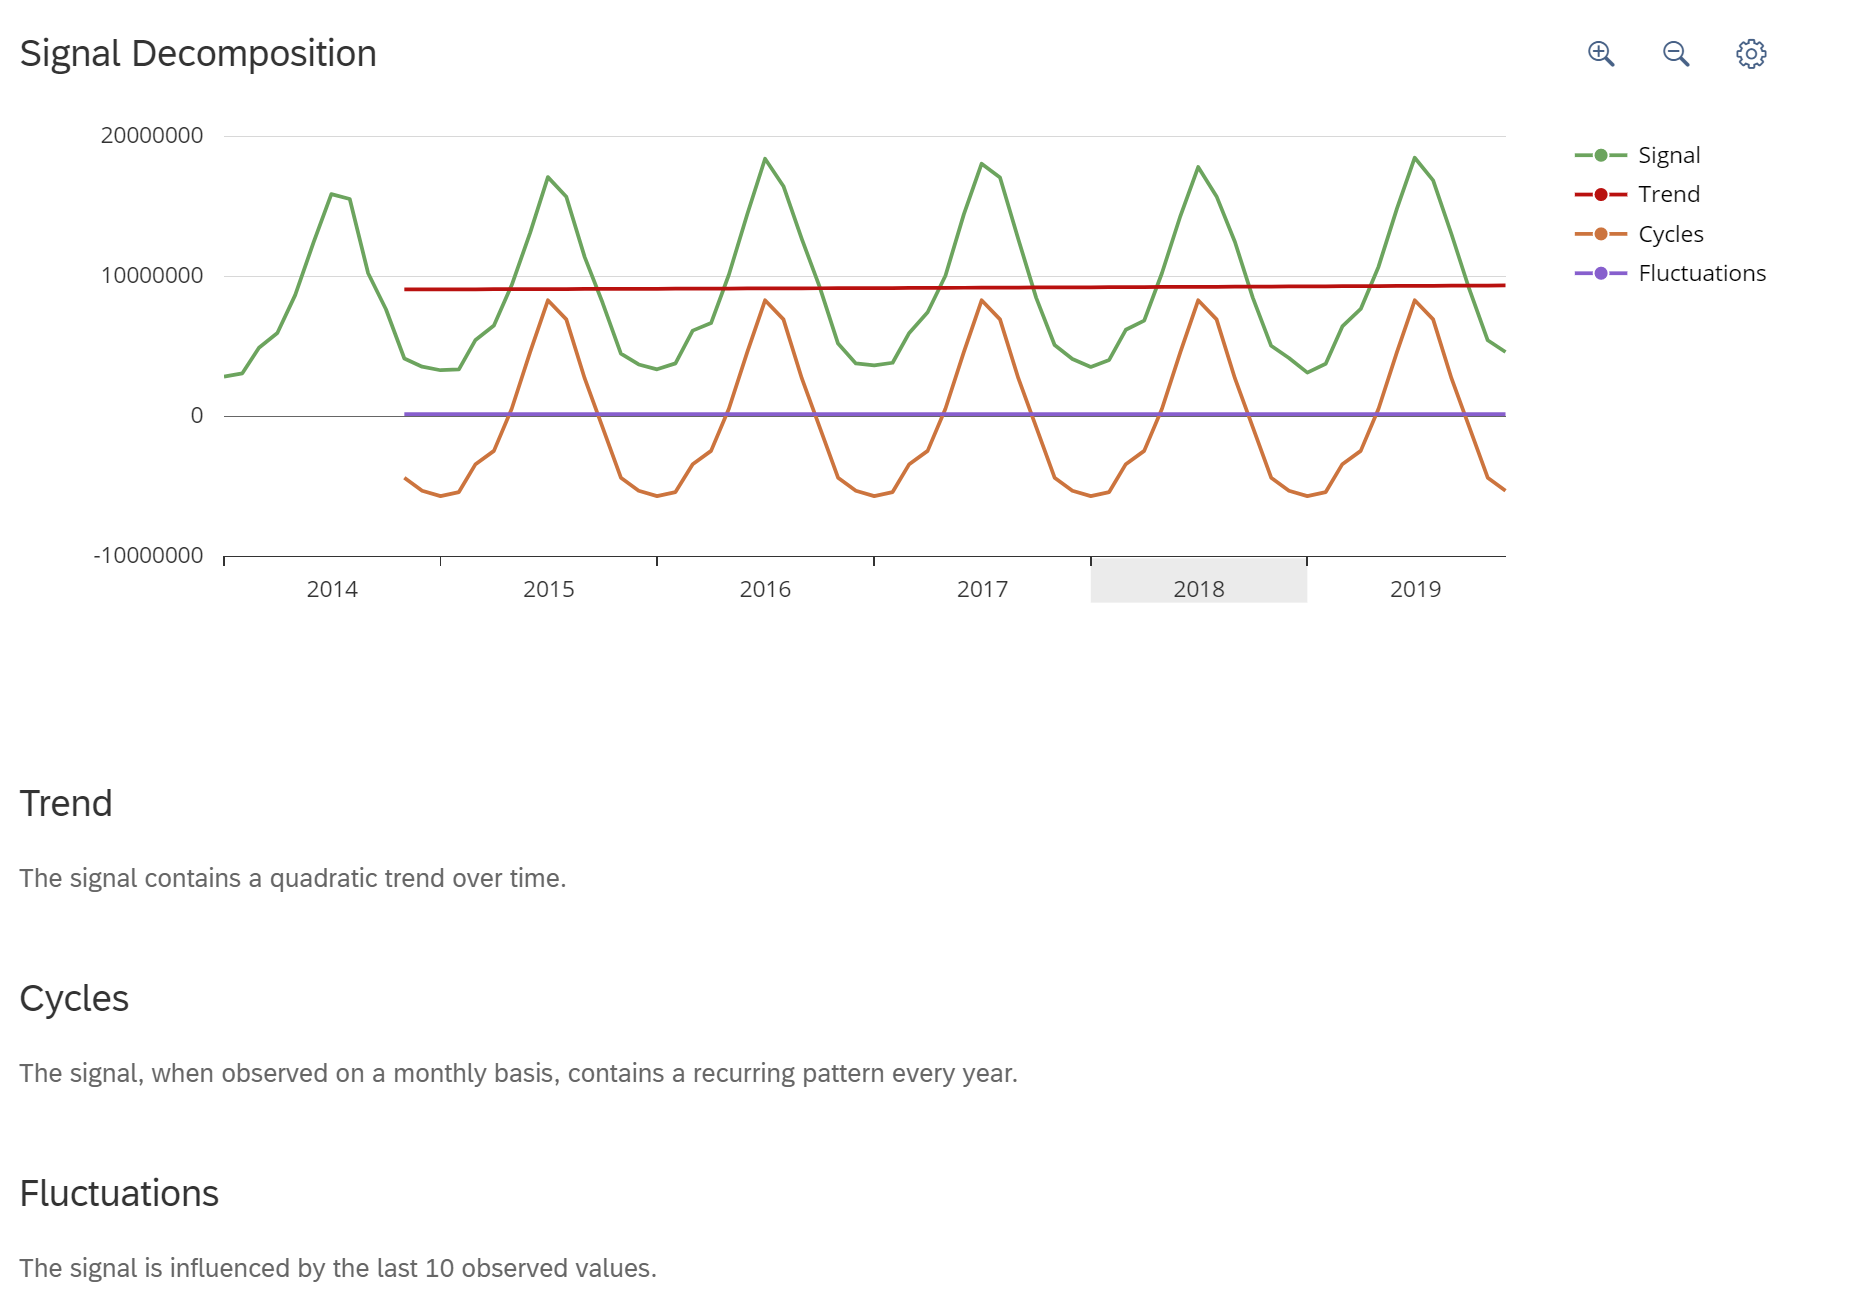
This predictive model contains three components:
- A trend which increases over time (the red part)
- A monthly cycle, this is the same we identified (the orange part)
- Fluctuations - the value for a given month depends on the past 10 monthly values (the purple part).
Please note the predictive model is additive. It means that summing up the trend, the cycle and the fluctuations give me the forecast.
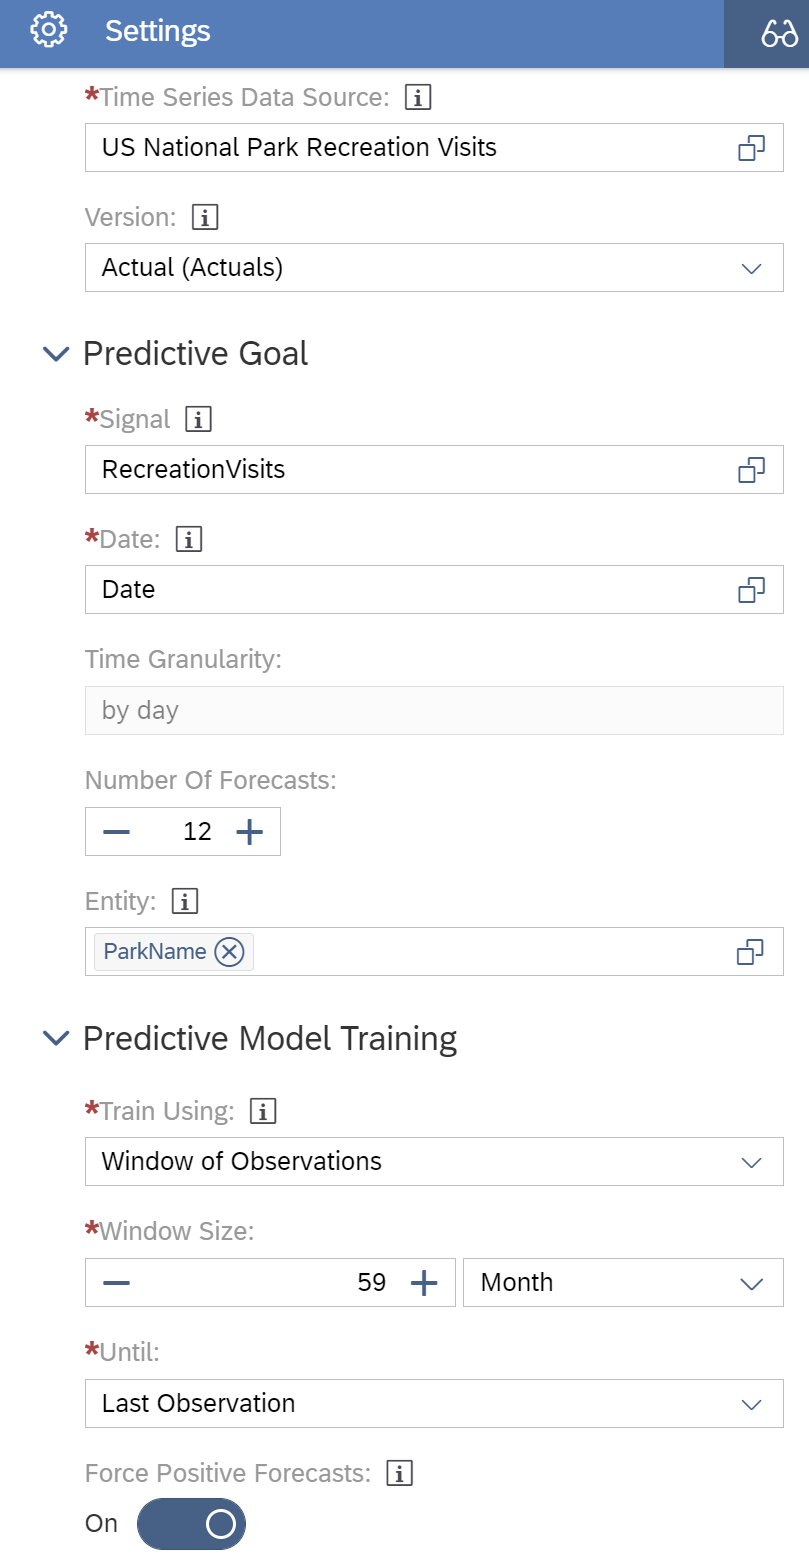
Predicting 2019 Visits at Park Level
I now configure a new predictive model. The only difference consists in having one time series model per US National Park. I specify this by selecting ParkName in the settings field named Entity.

In this scenario, I do not get one single model, I get as many predictive models as US National Parks (82). Some models are very accurate (Grand Canyon NP as one example) while other are less (Virgin Islands NP).


Writing Predictions Back
I create two private versions:
- one will receive the predictive forecasts generated at national level
- the second one will receive the predictive forecasts generated at park level

I now have:
- 2019 actuals in a public version
- two predictions for 2019, each of them stored in a separate private version that I can compare.
Comparing 2019 Actuals & Predictions in a Story
I created a story to compare actuals and 2019 predictions.
I used cross calculations to determine the variance as absolute number and percentage.
The first table compare 2019 predictions based on national numbers and actuals.
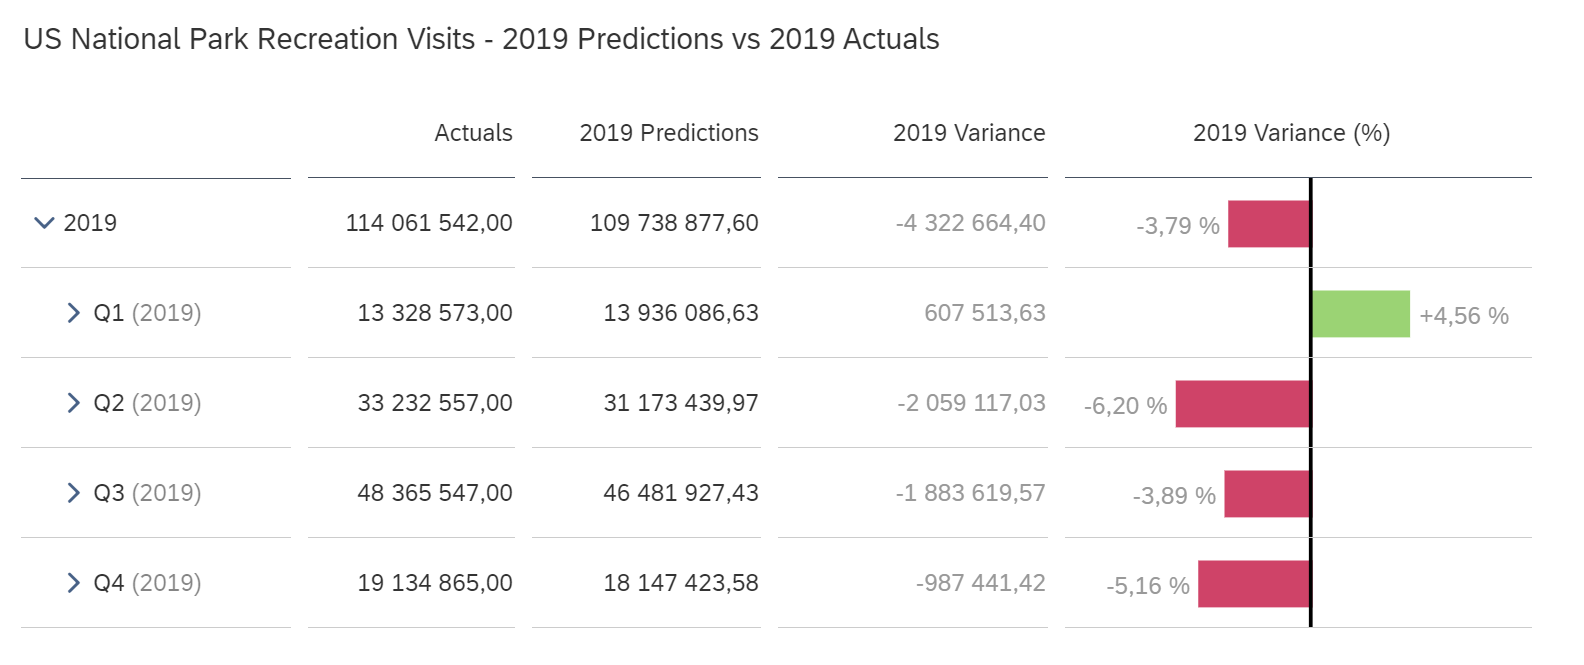
We can notice the following:
- The accuracy of the predictive model compared to the reality is good.
- Actuals have been under-estimated by 4,3 millions, corresponding to -3,8%
- The under-estimation has been more important for Q2 2019.
The second table compares:
- 2019 predictions created from individual park numbers and aggregated at national level
- 2019 actuals
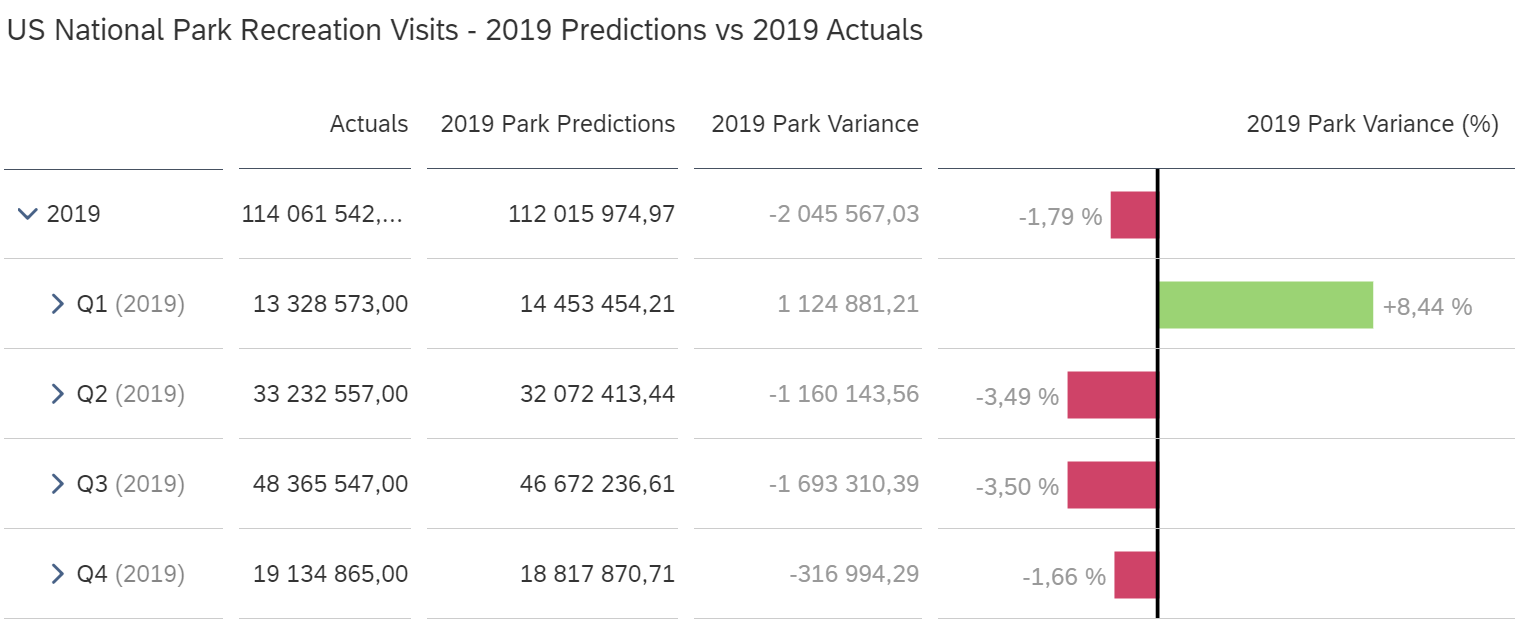
We can notice the following:
- The accuracy of the predictive model compared to the reality is very good.
- Actuals have been under-estimated by 2 millions, corresponding to -1,8%. There is a gain of 2% compared to the approach using national numbers.
- Q1 has been over-estimated by 8,4% while the other quarters have been under-estimated.
I used an input control to look to individual park predictions.
The predictions for Zion National Park are very accurate, with a total difference of 60.489 visits, or 1.35%. Q2/2019 and Q4/2019 predictions are very close with differences of less than one percent. Q1/2019 visits has been over-estimated by 30%.

Predicting 2020 Visits
I refresh my predictive model to include 2019 actuals and I predict January to December 2020.
I create two different predictive models:
- The first one uses the national numbers
- The second one uses the individual park numbers

These are the settings of the first predictive model. The field Until: is set to Last Observation. The data range used goes from January 2015 to December 2019.

The predictive model is comparable to the one used to predict 2019. We notice a slight variation of the Horizon-Wide MAPE.
These are the settings of the first predictive model. I set Entity to ParkName and Until: field to Last Observation. Again, the data range goes from January 2015 to December 2019.

We can notice that the Horizon-Wide MAPE evolves per every park, as we account for the 2019 actuals.
I write the predictions back to two new private versions and I report on them in a story.

When using the national numbers, the number of predicted visits for 2020 is 115,9 million, a 1.58% increase compared to 2019.

When using the park numbers, the number of predicted visits for 2020 is 116,4 million, a 2% increase compared to 2019.

In the case of Zion National Park, the predicted number of visitors is 4,56 million, a 1,62% increase compared to 2019.
It will be interesting to see the final 2020 numbers and compare them to the predictions here. 2020 was a very special year, and it could be that it reinforced American's love for their National Parks.
I hope you enjoyed reading this blog.
Do you want to learn more on Predictive Planning?
- You can read our other blogs.
- You can also explore our learning track.
- You can also go hands-on and experience SAP Analytics Cloud by yourself.
With this I wish you a merry Christmas and happy New Year 2021!


Labels:
1 Comment
You must be a registered user to add a comment. If you've already registered, sign in. Otherwise, register and sign in.
Labels in this area
-
ABAP CDS Views - CDC (Change Data Capture)
2 -
AI
1 -
Analyze Workload Data
1 -
BTP
1 -
Business and IT Integration
2 -
Business application stu
1 -
Business Technology Platform
1 -
Business Trends
1,661 -
Business Trends
86 -
CAP
1 -
cf
1 -
Cloud Foundry
1 -
Confluent
1 -
Customer COE Basics and Fundamentals
1 -
Customer COE Latest and Greatest
3 -
Customer Data Browser app
1 -
Data Analysis Tool
1 -
data migration
1 -
data transfer
1 -
Datasphere
2 -
Event Information
1,400 -
Event Information
64 -
Expert
1 -
Expert Insights
178 -
Expert Insights
270 -
General
1 -
Google cloud
1 -
Google Next'24
1 -
Kafka
1 -
Life at SAP
784 -
Life at SAP
11 -
Migrate your Data App
1 -
MTA
1 -
Network Performance Analysis
1 -
NodeJS
1 -
PDF
1 -
POC
1 -
Product Updates
4,578 -
Product Updates
323 -
Replication Flow
1 -
RisewithSAP
1 -
SAP BTP
1 -
SAP BTP Cloud Foundry
1 -
SAP Cloud ALM
1 -
SAP Cloud Application Programming Model
1 -
SAP Datasphere
2 -
SAP S4HANA Cloud
1 -
SAP S4HANA Migration Cockpit
1 -
Technology Updates
6,886 -
Technology Updates
395 -
Workload Fluctuations
1
Related Content
- Forecast Local Explanation with Automated Predictive (APL) in Technology Blogs by SAP
- What’s New in SAP Analytics Cloud Release 2024.07 in Technology Blogs by SAP
- Predictive Forecast Disaggregation in Technology Blogs by SAP
- Recap — SAP Data Unleashed 2024 in Technology Blogs by Members
- SAP Cloud ALM Implementation and Operations Configuration Webinar Series in Technology Blogs by SAP
Top kudoed authors
| User | Count |
|---|---|
| 11 | |
| 10 | |
| 10 | |
| 9 | |
| 8 | |
| 7 | |
| 7 | |
| 7 | |
| 7 | |
| 6 |