
- SAP Community
- Products and Technology
- Technology
- Technology Blogs by SAP
- Announcing Custom Widgets in SAP Analytics Cloud
Technology Blogs by SAP
Learn how to extend and personalize SAP applications. Follow the SAP technology blog for insights into SAP BTP, ABAP, SAP Analytics Cloud, SAP HANA, and more.
Turn on suggestions
Auto-suggest helps you quickly narrow down your search results by suggesting possible matches as you type.
Showing results for
Advisor
Options
- Subscribe to RSS Feed
- Mark as New
- Mark as Read
- Bookmark
- Subscribe
- Printer Friendly Page
- Report Inappropriate Content
11-25-2019
9:35 AM
Perhaps you read the release notes for release Q4 2019 of SAP Analytics Cloud, you might have run across this bit of text.
“You can now create your own custom widgets with the SAP Analytics Cloud Custom Widget SDK, which will allow you to extend the predefined set of widgets provided by the Analytics Designer! For more information please visit the help section.
”
Or perhaps you logged into your tenant and found a new menu option
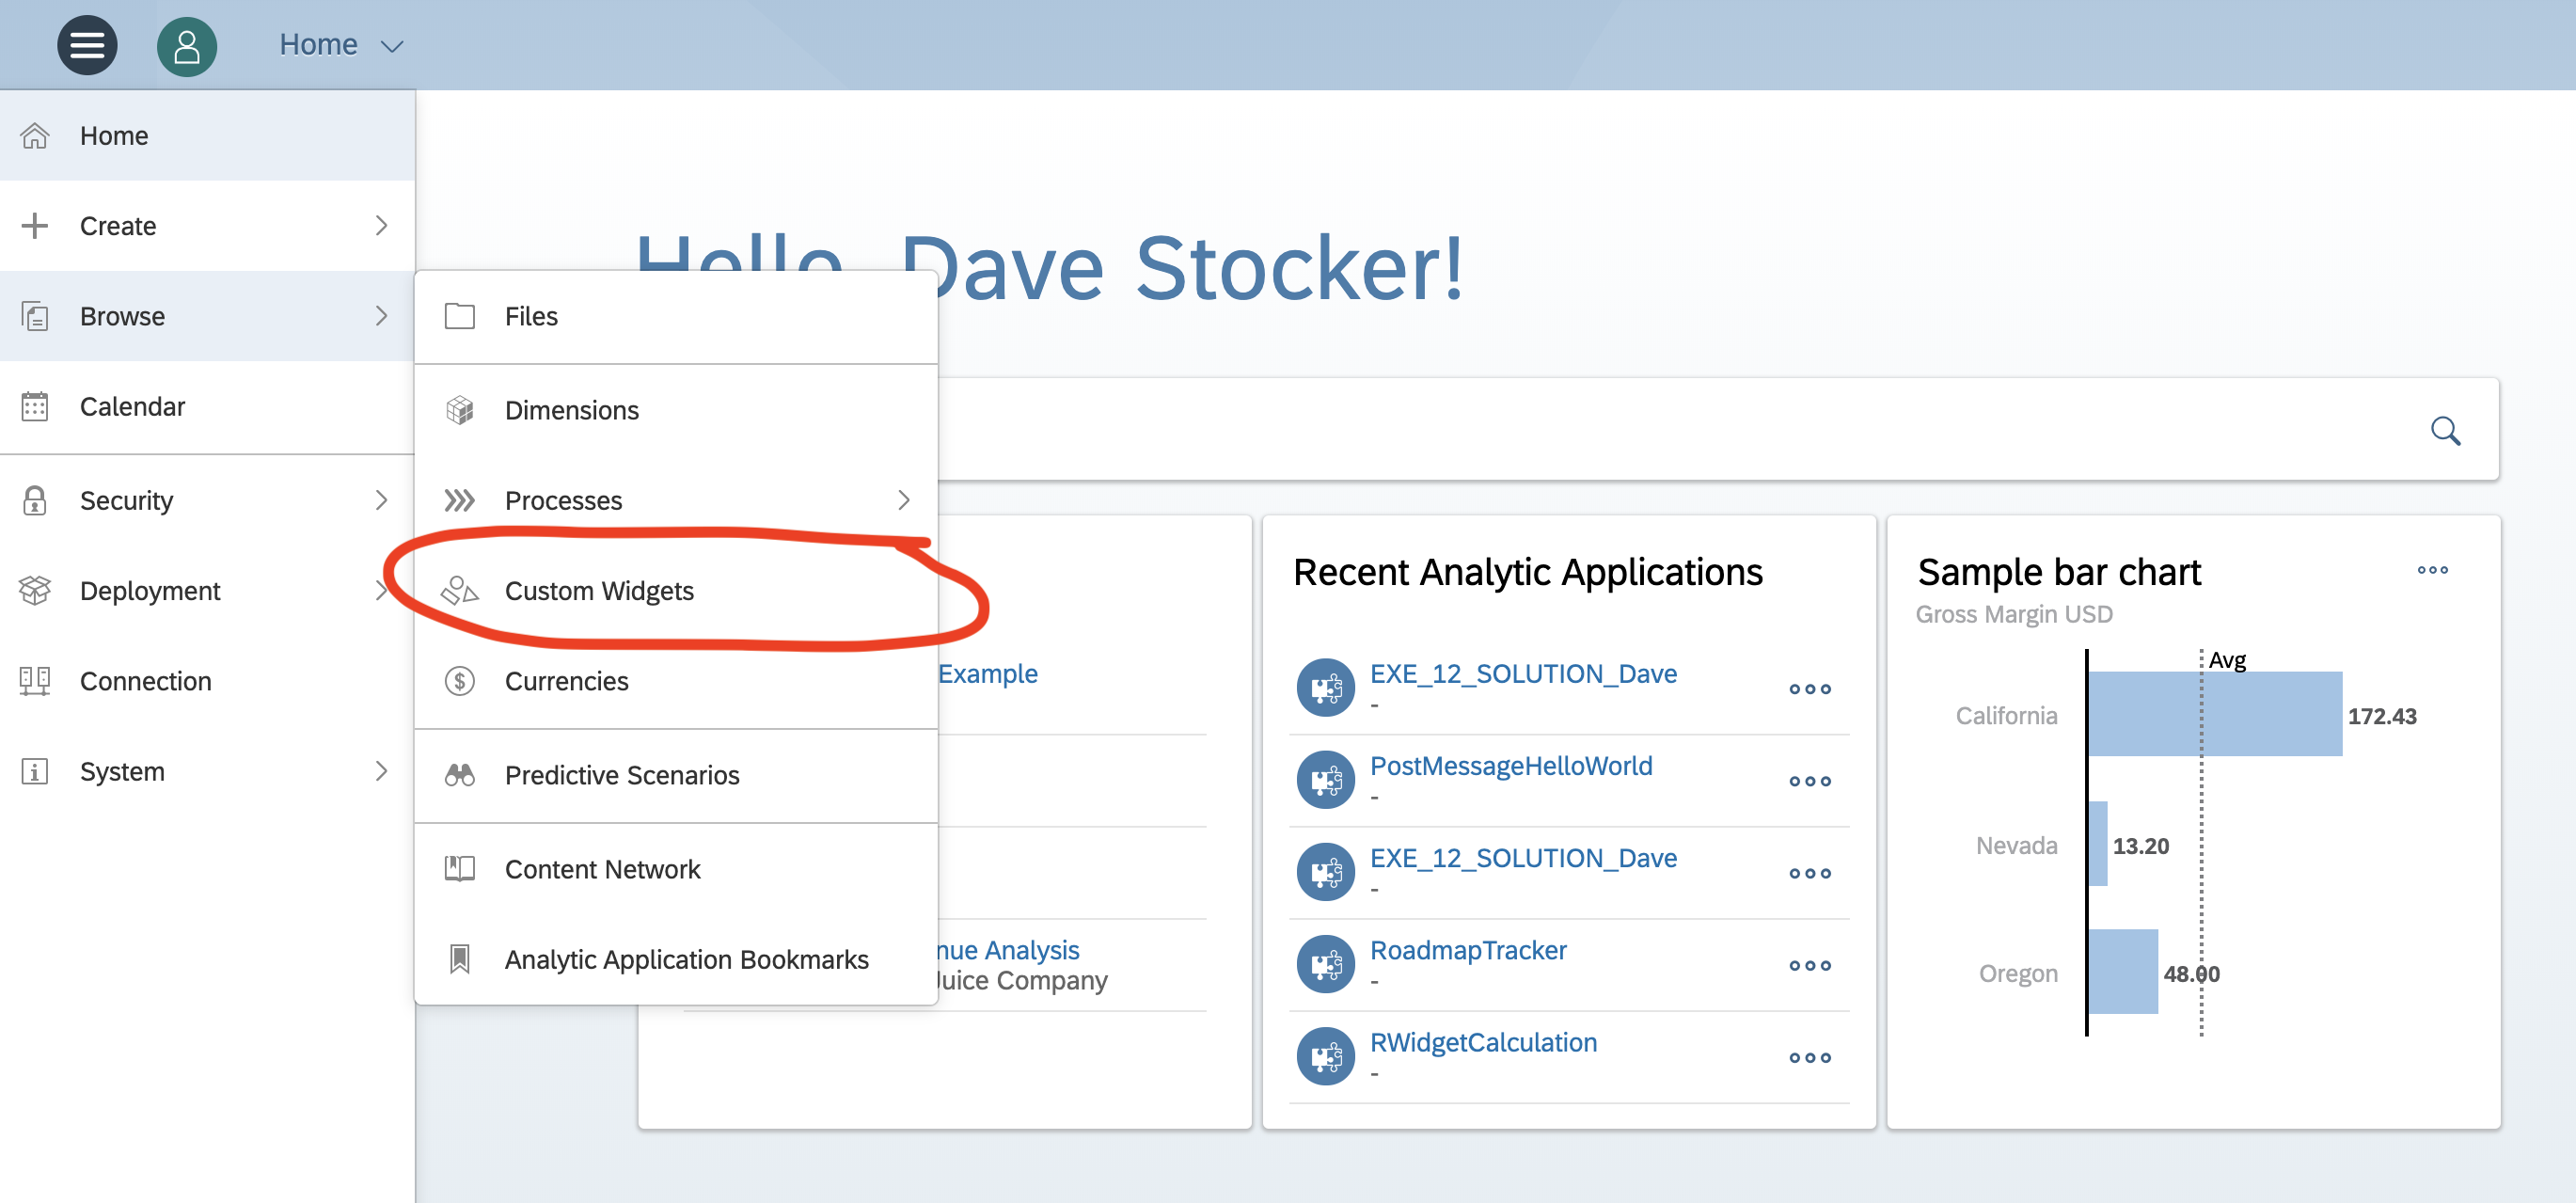
That’s right, the first iteration of custom widgets is finally available! So… what are custom widgets, why would you want them and how can you use them?
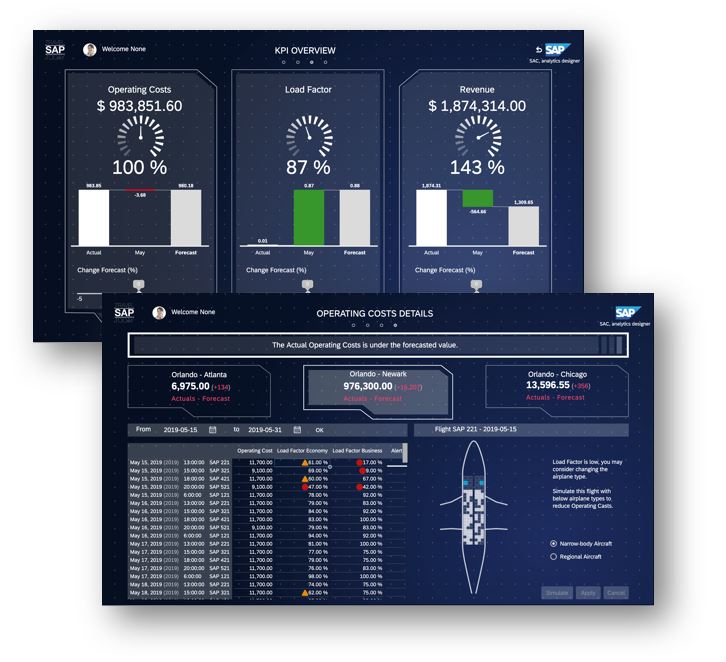
Custom widgets They are normal widgets that show up in the widget palette and work like any other widgets; except that they were built by customers or partners, instead of by SAP developers. They have properties, events and a script interface, just like SAP supplied widgets. You may have already seen custom widgets in demos. If you are familiar with the airline flight planning dashboard that we demoed at this year at SAPPHIRE or SAPInsider, you saw four custom widgets in action:
All four of these were built and deployed using the same custom widget workflow that is now publicly available.
Our list of requests for supporting chart types and controls is miles long. Miles…Long…. We have to prioritize the scenarios where we can benefit the majority of our customers. That’s where custom widgets come in. It seems that every everyone has at least one unique wish. You almost certainly have them too. Put a pen to paper and think of the different ways that you’d like to display information or interact, if you could.
Now you can!
It is very simple. Every widget consists of two things; a bit of JavaScript and metadata file. The metadata file has a .json filename extension and is called that because the metadata is organized as, wait for it, json. A customer who want to enable a custom widget on their system has to do one thing; simply upload that json file. That’s it. The widget will be enabled and will show up in your palette. If the future, we’ll enable the distribution of widgets via the content network, to make this management even easier.
You might already be familiar with the custom components that are available for Lumira Designer. SAP Analytics Cloud custom widgets are conceptually similar; a more advanced 2.0 version if you will. We began by interviewing customers who built their own widgets, partners who built widgets for customers and active members of the community component team. What did they like about the architecture, what was problematic and what would they like? A few things stood out.
Widget developers wanted us to minimize the learning curve but be forward looking. We did this by keeping many development concepts the same (e.g the metadata management file, the broad approach to adding properties and script methods), but modernizing (using json, instead of XML) using WebComponents for a clean extension of html, etc.
Widget developers want to use their favorite IDE and not be forced to use a particular one. Lumira Designer’s design time is an Eclipse RCP application. It extends eclipse and in turn offers up extension points. Lumira Designer component developers are in fact developing Eclipse extensions that extend Lumira Designer. In SAP Analytics cloud, we moved away from this. You only need to worry about your web design and can use your favorite IDE.
Widget developers edit, host and update their widgets on their own cycle. The javascript can be hosted on their favorite cloud hosting service and the customer only needs to install the metadata file to enable the widget. This allows for easy management and updating of widgets; something both developers and customers can agree is a good thing.
In the next days and weeks, I’ll be writing a short series on creating your first widget, along with some tips and tricks. You can also read the developer's handbook here.
With this first release of customer widgets, the sky is the limit on what you can build in SAP Analytics cloud. We have big enhancements planned as well. In mid 2020, we plan to bring direct data binding to widgets, so that they can directly read from data models. We also plan to enable custom widgets in stories. Right now, they only run in apps, but we’ll enable them in stories as well, allowing for write-once, run-anywhere widgets.
Stay tuned!
“You can now create your own custom widgets with the SAP Analytics Cloud Custom Widget SDK, which will allow you to extend the predefined set of widgets provided by the Analytics Designer! For more information please visit the help section.
”
Or perhaps you logged into your tenant and found a new menu option
That’s right, the first iteration of custom widgets is finally available! So… what are custom widgets, why would you want them and how can you use them?
What custom widgets are
Custom widgets They are normal widgets that show up in the widget palette and work like any other widgets; except that they were built by customers or partners, instead of by SAP developers. They have properties, events and a script interface, just like SAP supplied widgets. You may have already seen custom widgets in demos. If you are familiar with the airline flight planning dashboard that we demoed at this year at SAPPHIRE or SAPInsider, you saw four custom widgets in action:
- An animated gauge.
- An SVG widget, for showing various custom shapes in the dashboard.
- A date picker, which filtered the days on which we were looking at flights.
- A chart that looked a bit like a airline booking seat picker, but was in fact a heatmap of currently booked occupancy on a particular flight.
All four of these were built and deployed using the same custom widget workflow that is now publicly available.
Why you would want them
Our list of requests for supporting chart types and controls is miles long. Miles…Long…. We have to prioritize the scenarios where we can benefit the majority of our customers. That’s where custom widgets come in. It seems that every everyone has at least one unique wish. You almost certainly have them too. Put a pen to paper and think of the different ways that you’d like to display information or interact, if you could.
- Want to have that highly specialized KPI tile that displays your information exactly so, has scriptable fonts and is clickable? Or one that has an asymmetric layout?
- Want a butterfly table, with the dimensions shown down the middle and the measures to either side?
There are a million variants of the gauge. - Want a 3D pie chart? Every data design guru out there agrees that anything 3D is hard to read chart junk and we’ll probably never ship them in the standard product. But I guarantee you that there is someone out there that thinks they are the bees’ knees.
- Want to show a particular one-off diagram in a particular way?
Now you can!
How do customers use them?
It is very simple. Every widget consists of two things; a bit of JavaScript and metadata file. The metadata file has a .json filename extension and is called that because the metadata is organized as, wait for it, json. A customer who want to enable a custom widget on their system has to do one thing; simply upload that json file. That’s it. The widget will be enabled and will show up in your palette. If the future, we’ll enable the distribution of widgets via the content network, to make this management even easier.
How are they made?
You might already be familiar with the custom components that are available for Lumira Designer. SAP Analytics Cloud custom widgets are conceptually similar; a more advanced 2.0 version if you will. We began by interviewing customers who built their own widgets, partners who built widgets for customers and active members of the community component team. What did they like about the architecture, what was problematic and what would they like? A few things stood out.
Widget developers wanted us to minimize the learning curve but be forward looking. We did this by keeping many development concepts the same (e.g the metadata management file, the broad approach to adding properties and script methods), but modernizing (using json, instead of XML) using WebComponents for a clean extension of html, etc.
Widget developers want to use their favorite IDE and not be forced to use a particular one. Lumira Designer’s design time is an Eclipse RCP application. It extends eclipse and in turn offers up extension points. Lumira Designer component developers are in fact developing Eclipse extensions that extend Lumira Designer. In SAP Analytics cloud, we moved away from this. You only need to worry about your web design and can use your favorite IDE.
Widget developers edit, host and update their widgets on their own cycle. The javascript can be hosted on their favorite cloud hosting service and the customer only needs to install the metadata file to enable the widget. This allows for easy management and updating of widgets; something both developers and customers can agree is a good thing.
In the next days and weeks, I’ll be writing a short series on creating your first widget, along with some tips and tricks. You can also read the developer's handbook here.
Looking to the future
With this first release of customer widgets, the sky is the limit on what you can build in SAP Analytics cloud. We have big enhancements planned as well. In mid 2020, we plan to bring direct data binding to widgets, so that they can directly read from data models. We also plan to enable custom widgets in stories. Right now, they only run in apps, but we’ll enable them in stories as well, allowing for write-once, run-anywhere widgets.
Stay tuned!
- SAP Managed Tags:
- SAP Analytics Cloud
Labels:
25 Comments
You must be a registered user to add a comment. If you've already registered, sign in. Otherwise, register and sign in.
Labels in this area
-
ABAP CDS Views - CDC (Change Data Capture)
2 -
AI
1 -
Analyze Workload Data
1 -
BTP
1 -
Business and IT Integration
2 -
Business application stu
1 -
Business Technology Platform
1 -
Business Trends
1,661 -
Business Trends
85 -
CAP
1 -
cf
1 -
Cloud Foundry
1 -
Confluent
1 -
Customer COE Basics and Fundamentals
1 -
Customer COE Latest and Greatest
3 -
Customer Data Browser app
1 -
Data Analysis Tool
1 -
data migration
1 -
data transfer
1 -
Datasphere
2 -
Event Information
1,400 -
Event Information
64 -
Expert
1 -
Expert Insights
178 -
Expert Insights
268 -
General
1 -
Google cloud
1 -
Google Next'24
1 -
Kafka
1 -
Life at SAP
784 -
Life at SAP
10 -
Migrate your Data App
1 -
MTA
1 -
Network Performance Analysis
1 -
NodeJS
1 -
PDF
1 -
POC
1 -
Product Updates
4,579 -
Product Updates
316 -
Replication Flow
1 -
RisewithSAP
1 -
SAP BTP
1 -
SAP BTP Cloud Foundry
1 -
SAP Cloud ALM
1 -
SAP Cloud Application Programming Model
1 -
SAP Datasphere
2 -
SAP S4HANA Cloud
1 -
SAP S4HANA Migration Cockpit
1 -
Technology Updates
6,886 -
Technology Updates
388 -
Workload Fluctuations
1
Related Content
- Horizon Theme and Templates for Stories in SAP Analytics Cloud in Technology Blogs by SAP
- What’s New in SAP Analytics Cloud Release 2024.07 in Technology Blogs by SAP
- Optimized Design Experience in SAP Analytics Cloud - Building Containers in a no code Environment in Technology Blogs by SAP
- Responsive vs. Canvas in SAP Analytics Cloud with Optimized Design Experience in Technology Blogs by Members
- How to Develop an SAP Analytics Cloud Custom Widget for Attaching Files by Browsing? in Technology Q&A
Top kudoed authors
| User | Count |
|---|---|
| 17 | |
| 13 | |
| 11 | |
| 10 | |
| 9 | |
| 9 | |
| 9 | |
| 9 | |
| 9 | |
| 8 |