Dear community members,
The blog I published on
Collaborative Planning enabled by Integrated Business Planning and SAP Analytics Cloud generated quite some traffic and the request to share also how the integration works from a technical point of view.
SAP Application Help for IBP is doing a great job explaining step by step the configuration required on the IBP side to enable the integration. I could also find a blog which gives a visual overview of all these steps:
CDC for SAP IBP: Setup the Communication Arrangement.
As it does not bring any value to reiterate things that are already properly documented, I am using this blog to focus more on SAC, how SAC looks like through IBP lens.
The below steps show how to create a simple data exchange query to integrate data from IBP into SAC.
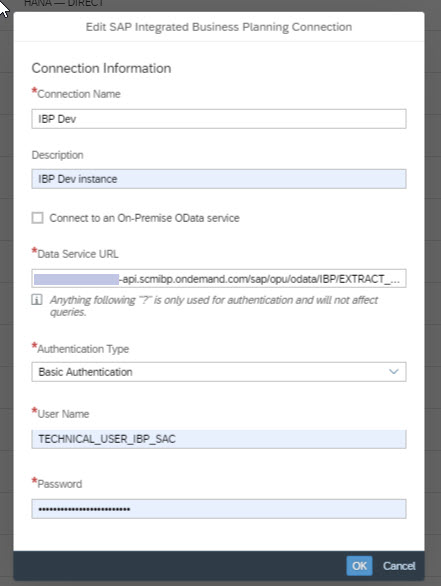
Step 1: Enable the connection between IBP and SAC
In SAC, you can create a data connection with IBP only after you completed the prerequisites in IBP. The IBP communication arrangement generates the Data Service URL you provide as input in the connection definition in SAC.
Step 2: Create a model in SAC (or use an existing model)
To work with data in SAC, you require a model. Models in SAC consist mainly of:
- Dimensions: similar to dimensions in IBP, they are qualitative. In the below model, besides the date dimension, I added four generic dimensions, which correspond to master data entities from IBP: Customer, Product, Resources and Location. You can also observe the Version Dimension, which you use to define data versions for your measures.

- Measures: similar to key figures in IBP, they are numeric values, can support calculations and are used to hold transactional data. But there is one big difference to IBP, which the umbrella name (“Account”) of these measures also suggests: SAC uses an account-based model, which means that measures can be assigned to a GL account, based on which they are included in the Profit and Loss or Balance Sheet calculations.
What I like at measures definition in SAC is the simplicity of defining aggregation exceptions, to relate to one or more dimensions.

Step 3: Create the dataflow/interface
Within the model, you find the data management tab where you can define new import or export jobs or re-run existing ones.
You can observe in below image that I am selecting from IBP the Constrained Revenue at Product Id, Customer Id and Month level. I also used the filter section to restrict the amount of data I read.

Committing the selection will bring the data in SAC, allowing you to manipulate it before loading it to your model.
Loading transactional data to a SAC model is different than from loading it to an IBP planning area, where one must load data at the root attributes defined in the planning level. In SAC there is no such concept. In this example, for loading Constrained Revenue in the model, which includes Locations and Resources as dimensions, required me to map also the Resources and Locations, besides the Product and Customer. This meant that I had to map all dimensions that are part of the model. As my input from IBP did not include this information, I assigned both dimensions with a default value "#".

At this stage of mapping the data, you can also choose where to load the data: in an already existing version or a new ad-hoc created version. Once you mapped the dimensions and measures, you may validate data to see if there are any inconsistencies. When not, Finish Mapping will load the data to your model and you will be able to use it in stories.
Step 4: Use the loaded data in a story
A story is a presentation-style document that uses charts, visualisations, text, images, and pictograms to describe data. To some extent, it is similar to the IBP dashboard.
I added the below chart to my story to compare the constrained revenue received from IBP with the revenue target defined in the budget exercise directly in SAC. I used the same measure, but I read it from two different versions: Constrained Growth Strategy and Target.

If you are interested to learn more about SAC, you can check the solution page on
https://help.sap.com/
Cheers,
Alecsandra
