
- SAP Community
- Groups
- Interest Groups
- Artificial Intelligence and Machine Learning
- Blogs
- Machine Learning with SAP HANA - with R API. Part ...
Artificial Intelligence and Machine Learning Blogs
Explore AI and ML blogs. Discover use cases, advancements, and the transformative potential of AI for businesses. Stay informed of trends and applications.
Turn on suggestions
Auto-suggest helps you quickly narrow down your search results by suggesting possible matches as you type.
Showing results for
former_member18
Participant
Options
- Subscribe to RSS Feed
- Mark as New
- Mark as Read
- Bookmark
- Subscribe
- Printer Friendly Page
- Report Inappropriate Content
06-07-2019
11:07 AM
In this blog, I will continue from part 1 and show how to build machine learning models in Rstudio and execute directly in SAP HANA without moving data out of HANA. Also in this part, I will give examples on how to bring Machine Learning Models into a production-ready environment.
I will show how to build a machine learning model from RStudio or your preferred R GUI on SAP HANA without moving the training data to the R client. This approach allows fast and interactive machine learning training and deployment with SAP HANA.
Contents:
1. Machine learning with SAP HANA - all Interaction performed directly from R
The use case presented in this blog is a rather simple dataset. I have chosen this dataset so that you potentially can re-do the steps I am showing in your own environment. The data science challenge is a classic supervised binary classification. Given a number of features all with certain characteristics, our goal is to build a machine learning model to identify people affected by type 2 diabetes.
Data description:
pregnant: Number of times pregnant
glucose: GlucosePlasma glucose concentration a 2 hours in an oral glucose tolerance test
pressure: BloodPressureDiastolic blood pressure (mm Hg)
triceps: SkinThicknessTriceps skin fold thickness (mm)
insulin: Insulin2-Hour serum (mu U/ml)
mass: BMIBody mass index (weight in kg/(height in m)^2)
pedigree: Diabetes pedigree function
age: Age in years
diabetes: Outcome Class variable (0 or 1). 268 of 768 are 1, the remaining are 0.

2. Creating and evaluating Machine Learning models.
In this blog, I am focusing on the machine learning model evaluation and deployment. In a future blog post, I will show how to prepare data for consumption in machine learning models. The data preparation step is essential for squeezing out all the possible information in training data and hence well-performing models.
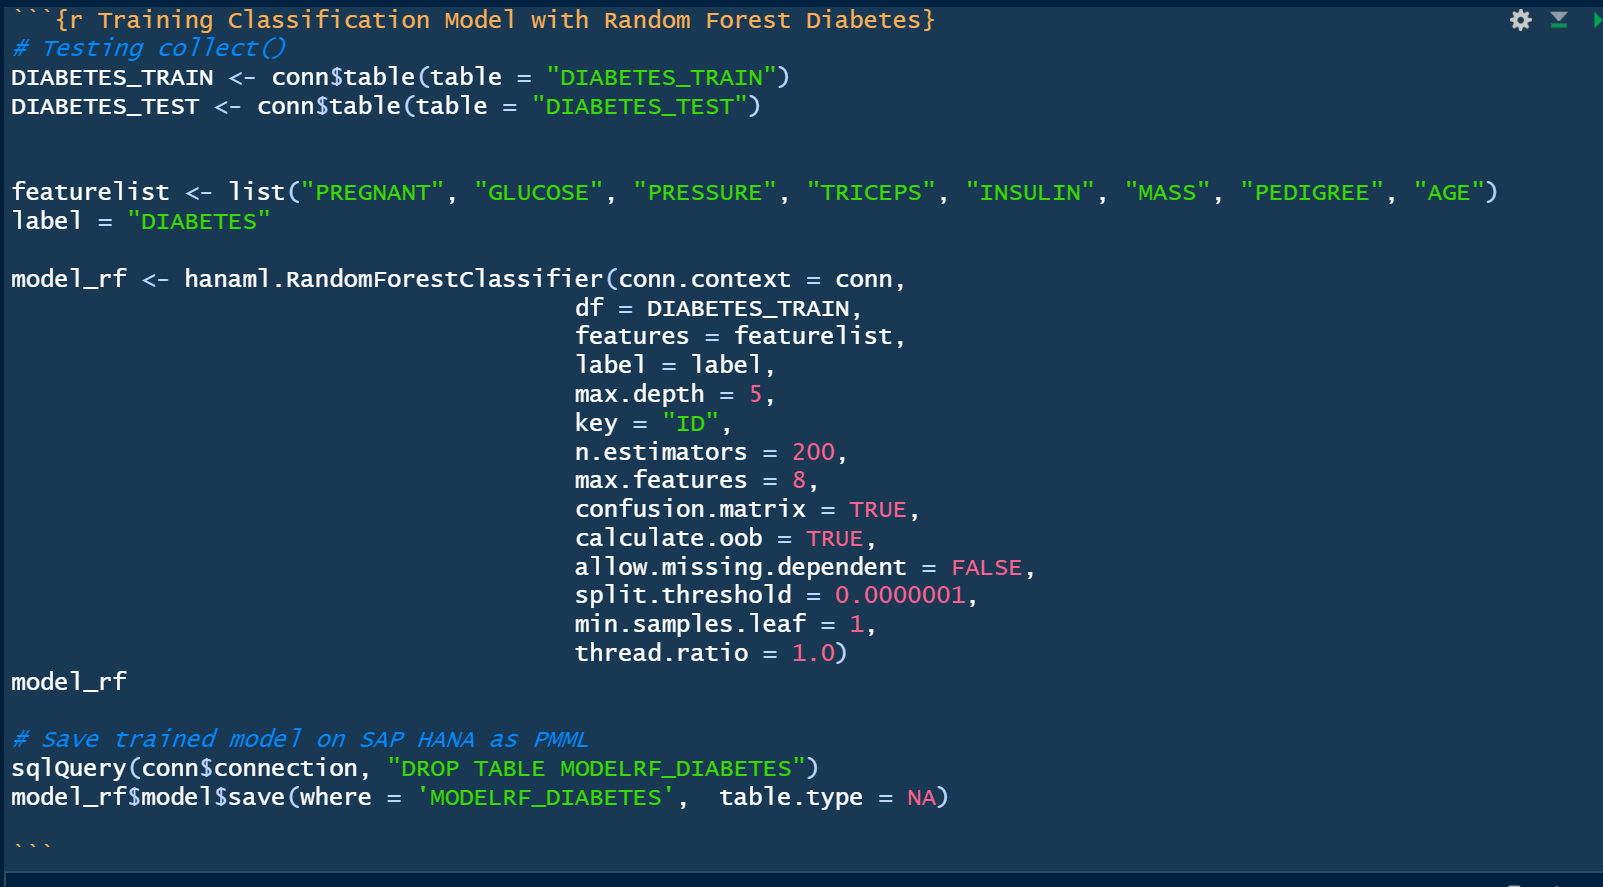
Creating a Machine Learning model from scratch and saving the model to SAP HANA.
The model has now been built and saved - this can be verified in SAP HANA Studio:

As shown above, the model is now stored as a PMML format (Predictive Markup Model Language).
Evaluating Machine Learning models
The Receiver Operating Characteristic (ROC) curve is used to assess the accuracy of a continuous measurement for predicting a 2 class outcome (bi-variant classification). In marketing, sales, medicine etc., the ROC curves have a long history of use for evaluating the usability of machine learning models. In a nut shell the ROC curves helps identify whether the build machine learning model provides better than random selection, however it can also help identify the optimim treshold of true positives and false negatives. This can be very valuable in use cases where for instance there is a cost associated with contacting customers. Below is the ROC-curve for the Insurance use case. Selecting approximately 20% (x-axis) of the most probable customers yields approx. 50% of the total customers interested in buying additional insurances.

The code needed to generate the above ROC curve and calculating the Area Under the Curve (AUC). The important part here is the hanaml.Auc PAL algorithm that calculates both the AUC score and creates a table with the ROC values.

The ROC table that the hanaml.Auc function builds is already prepared for visualization as it contains pre-calculated points for both False Positive and True Positives.

The simple R code needed for the charts (3 different ways of creating the same chart):

Scoring the machine learning model on training- and test-data:

Confusion Matrix for Classification machine learning models.

While it is rather straight forward to create the confusion matrix using the hanaml.Confusion.matrix function I will in the following show a more comprehensive and illustrative approach.
Using carets confusionMatrix function:

Building a more comprehensive confusion matrix. I found some code snippets on StackOverflow (https://stackoverflow.com/questions/23891140/r-how-to-visualize-confusion-matrix-using-the-caret-pac...) that I enhanced and changed to fit my needs. I will post the code in my GitHub (see link below).
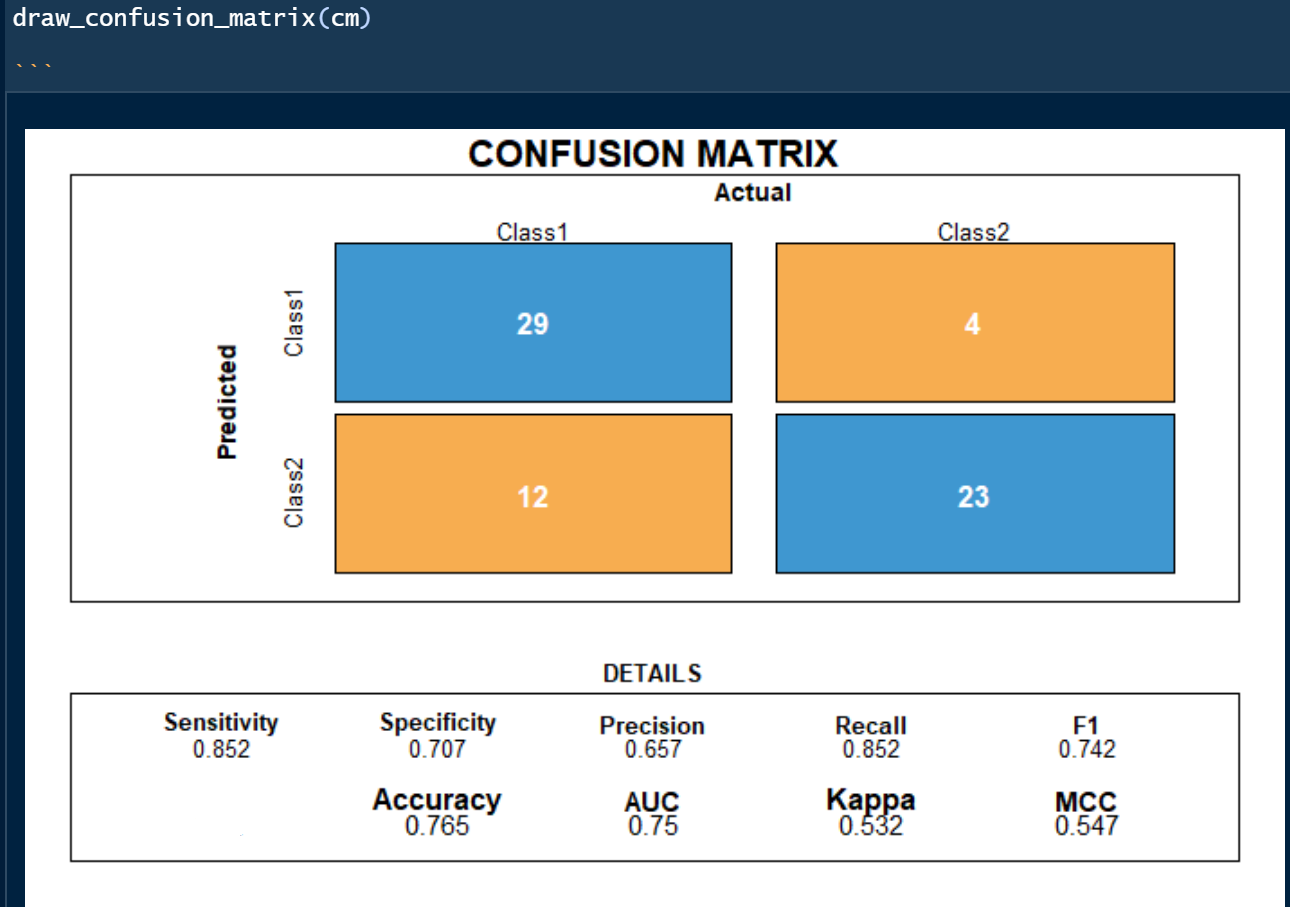
(Screenshot from my function that creates a summary confusion matrix and selected KPI’s - values are from another model). Function available on my github.
3. Deploying models to production with SAP HANA
Loading ML models from SAP HANA back to the R environment. You are not actually loading the model into the local R environment - just the metadata about the model.
As of writing this blog, it is necessary to have a small pre-burner step in order to have R recognize that the model loaded from SAP HANA is an ML model. As shown below I actually train a model, however only with a few records. This step is obviously very fast due to the small training rows and as mentioned only needed to allow for overwriting the saved model in the next step.
The model size is only 2 rows:
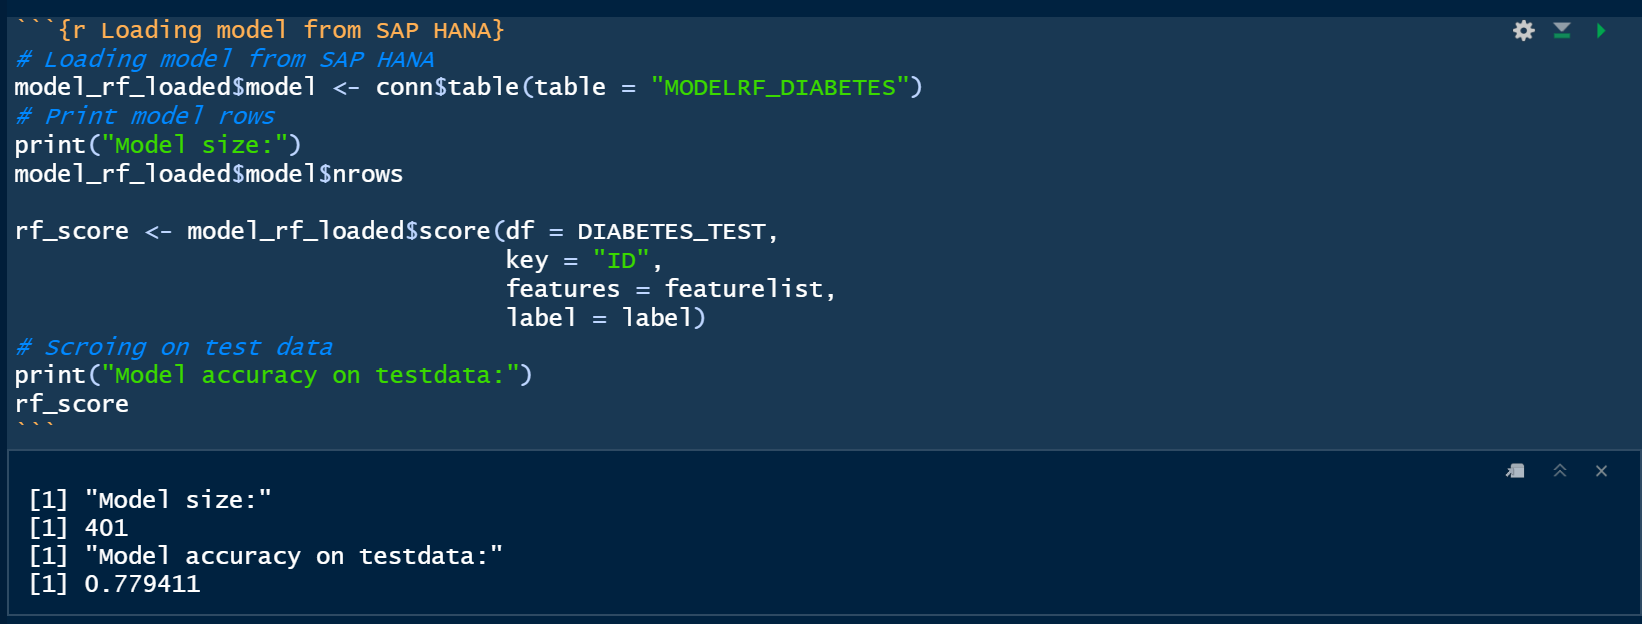
Loading the model stored in SAP HANA. As shown below the model size is now 401 rows which correspond to the actual PMML model.
Applying models to new data - predicting outcomes and storing the results in SAP HANA:

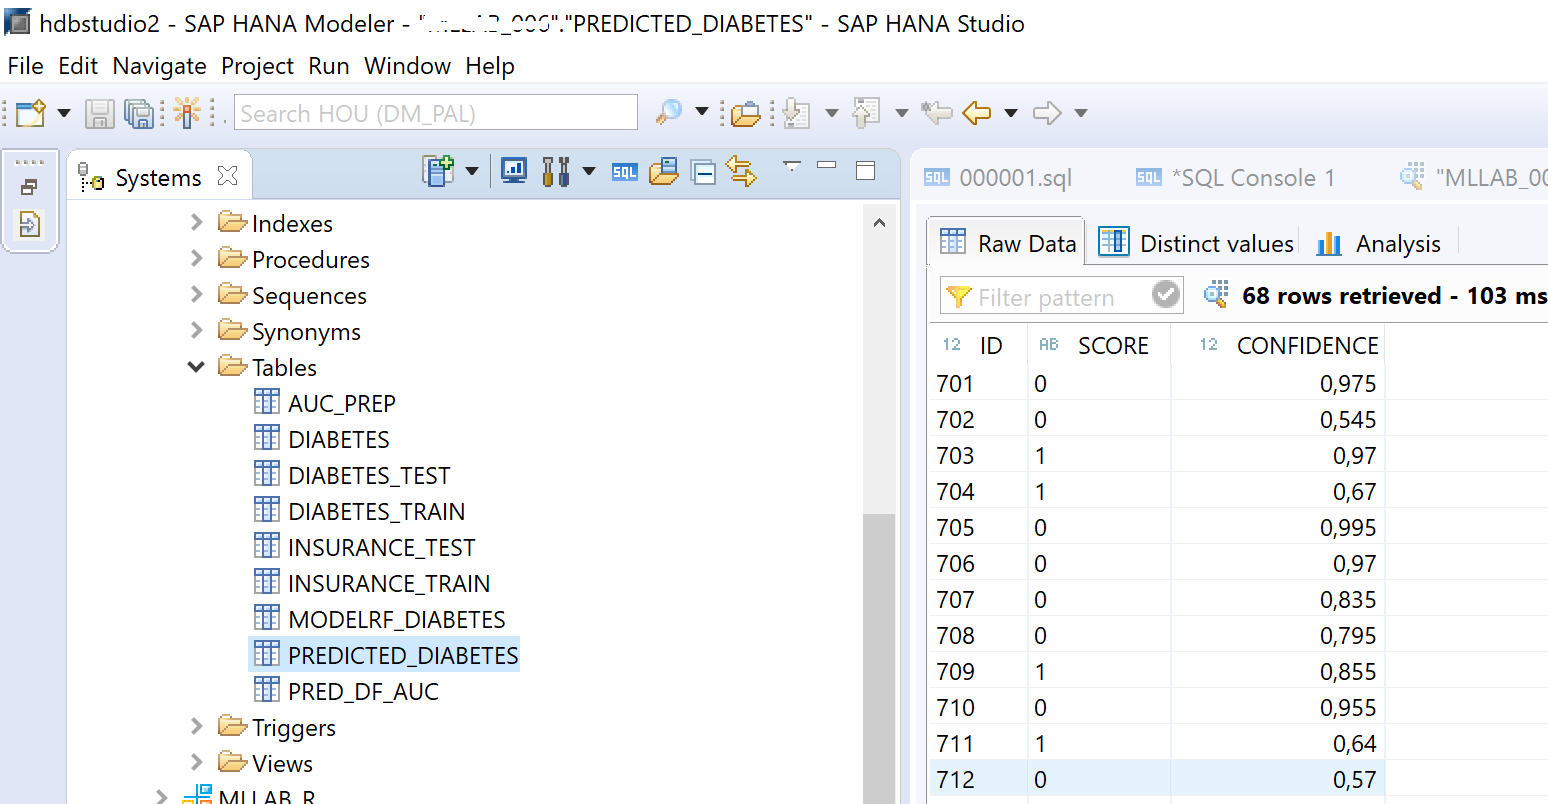
In SAP HANA Studio we now have a new table that contains all the predictions and the confidence of that prediction.
Scheduling models.
There are multiple ways of scheduling the re-training or applying the machine learning model with new data. I have chosen to use a simple approach with Windows task scheduler that is built-in with Windows 10.

Creating a new task in Task Scheduler.

Monitoring your scheduled jobs. Below I have shown my scheduled task that predicts diabetes in new patient data. The job will run unmanned at the time interval of my choosing.

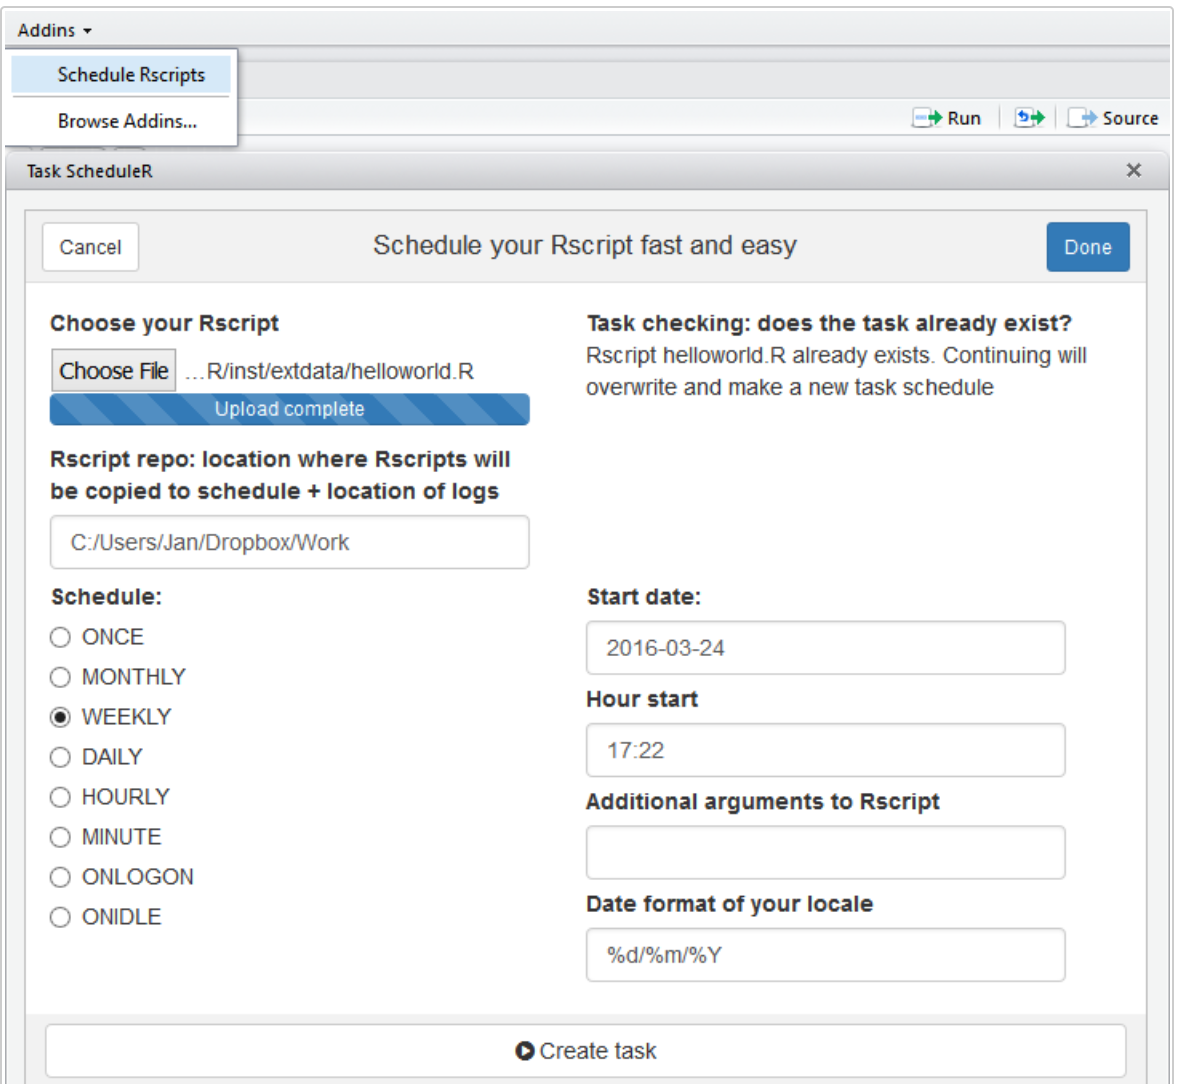
If you prefer there is actually an R package that does the task scheduling for you.

The package "taskscheduleR" allows for both a GUI and scripted approach.
For the scripted approach here is an example of managing a schedule.
If you are using RStudio taskscheduleR can actually be embedded as an Addin as shown below:
I hope you enjoyed the blog post where I showed how to build, evaluate and deploy a machine learning model to a production scheduled state with creating new predictions and storing the results in SAP HANA tables.
I will likely in a future post intensify the data preparation tasks that are from my experience also essential for squeezing information out of historical training data and in the end build better machine learning models.
Links to references:
I will show how to build a machine learning model from RStudio or your preferred R GUI on SAP HANA without moving the training data to the R client. This approach allows fast and interactive machine learning training and deployment with SAP HANA.
Contents:
- Machine learning use case.
- Evaluating Machine Learning models.
- Deploying models to production with SAP HANA
1. Machine learning with SAP HANA - all Interaction performed directly from R
The use case presented in this blog is a rather simple dataset. I have chosen this dataset so that you potentially can re-do the steps I am showing in your own environment. The data science challenge is a classic supervised binary classification. Given a number of features all with certain characteristics, our goal is to build a machine learning model to identify people affected by type 2 diabetes.
Data description:
pregnant: Number of times pregnant
glucose: GlucosePlasma glucose concentration a 2 hours in an oral glucose tolerance test
pressure: BloodPressureDiastolic blood pressure (mm Hg)
triceps: SkinThicknessTriceps skin fold thickness (mm)
insulin: Insulin2-Hour serum (mu U/ml)
mass: BMIBody mass index (weight in kg/(height in m)^2)
pedigree: Diabetes pedigree function
age: Age in years
diabetes: Outcome Class variable (0 or 1). 268 of 768 are 1, the remaining are 0.
2. Creating and evaluating Machine Learning models.
In this blog, I am focusing on the machine learning model evaluation and deployment. In a future blog post, I will show how to prepare data for consumption in machine learning models. The data preparation step is essential for squeezing out all the possible information in training data and hence well-performing models.
Creating a Machine Learning model from scratch and saving the model to SAP HANA.
The model has now been built and saved - this can be verified in SAP HANA Studio:
As shown above, the model is now stored as a PMML format (Predictive Markup Model Language).
Evaluating Machine Learning models
The Receiver Operating Characteristic (ROC) curve is used to assess the accuracy of a continuous measurement for predicting a 2 class outcome (bi-variant classification). In marketing, sales, medicine etc., the ROC curves have a long history of use for evaluating the usability of machine learning models. In a nut shell the ROC curves helps identify whether the build machine learning model provides better than random selection, however it can also help identify the optimim treshold of true positives and false negatives. This can be very valuable in use cases where for instance there is a cost associated with contacting customers. Below is the ROC-curve for the Insurance use case. Selecting approximately 20% (x-axis) of the most probable customers yields approx. 50% of the total customers interested in buying additional insurances.
The code needed to generate the above ROC curve and calculating the Area Under the Curve (AUC). The important part here is the hanaml.Auc PAL algorithm that calculates both the AUC score and creates a table with the ROC values.
The ROC table that the hanaml.Auc function builds is already prepared for visualization as it contains pre-calculated points for both False Positive and True Positives.
The simple R code needed for the charts (3 different ways of creating the same chart):
Scoring the machine learning model on training- and test-data:
Confusion Matrix for Classification machine learning models.
While it is rather straight forward to create the confusion matrix using the hanaml.Confusion.matrix function I will in the following show a more comprehensive and illustrative approach.
- Using the famous caret (classification and regression training) package to build the confusion matrix and related KPI metrics.
- Building a more comprehensive confusion matrix.
Using carets confusionMatrix function:
Building a more comprehensive confusion matrix. I found some code snippets on StackOverflow (https://stackoverflow.com/questions/23891140/r-how-to-visualize-confusion-matrix-using-the-caret-pac...) that I enhanced and changed to fit my needs. I will post the code in my GitHub (see link below).
(Screenshot from my function that creates a summary confusion matrix and selected KPI’s - values are from another model). Function available on my github.
3. Deploying models to production with SAP HANA
Loading ML models from SAP HANA back to the R environment. You are not actually loading the model into the local R environment - just the metadata about the model.
As of writing this blog, it is necessary to have a small pre-burner step in order to have R recognize that the model loaded from SAP HANA is an ML model. As shown below I actually train a model, however only with a few records. This step is obviously very fast due to the small training rows and as mentioned only needed to allow for overwriting the saved model in the next step.
The model size is only 2 rows:
Loading the model stored in SAP HANA. As shown below the model size is now 401 rows which correspond to the actual PMML model.
Applying models to new data - predicting outcomes and storing the results in SAP HANA:
In SAP HANA Studio we now have a new table that contains all the predictions and the confidence of that prediction.
Scheduling models.
There are multiple ways of scheduling the re-training or applying the machine learning model with new data. I have chosen to use a simple approach with Windows task scheduler that is built-in with Windows 10.
Creating a new task in Task Scheduler.
- Point to the location of your R installation and select R.exe.
- In the Add arguments type in CMD BATCH "your location of the Script.R".
Monitoring your scheduled jobs. Below I have shown my scheduled task that predicts diabetes in new patient data. The job will run unmanned at the time interval of my choosing.
If you prefer there is actually an R package that does the task scheduling for you.
The package "taskscheduleR" allows for both a GUI and scripted approach.
For the scripted approach here is an example of managing a schedule.
If you are using RStudio taskscheduleR can actually be embedded as an Addin as shown below:
I hope you enjoyed the blog post where I showed how to build, evaluate and deploy a machine learning model to a production scheduled state with creating new predictions and storing the results in SAP HANA tables.
I will likely in a future post intensify the data preparation tasks that are from my experience also essential for squeezing information out of historical training data and in the end build better machine learning models.
Links to references:
- Github - access the scripts and data sources used in this blog. https://github.com/kurtholst/HANA_R_ML
- Part 1 SAP HANA Machine learning blog.https://blogs.sap.com/2019/04/09/machine-learning-with-sap-hana-from-r/?preview_id=801758
- Task scheduler with R. https://cran.r-project.org/web/packages/taskscheduleR/vignettes/taskscheduleR.html
- SAP HANA PAL Documentation – https://help.sap.com/viewer/2cfbc5cf2bc14f028cfbe2a2bba60a50/2.0.03/en-US/c9eeed704f3f4ec39441434db8...
- Pima Indians dataset. https://www.kaggle.com/uciml/pima-indians-diabetes-database
- SAP Managed Tags:
- Machine Learning
7 Comments
You must be a registered user to add a comment. If you've already registered, sign in. Otherwise, register and sign in.
Labels in this area
-
Agents
3 -
AI
5 -
AI Launchpad
2 -
Artificial Intelligence
2 -
Artificial Intelligence (AI)
3 -
Brainstorming
1 -
BTP
1 -
Business AI
2 -
Business Trends
1 -
Cloud Foundry
1 -
Data and Analytics (DA)
1 -
Design and Engineering
1 -
forecasting
1 -
GenAI
1 -
Generative AI
4 -
Generative AI Hub
4 -
Graph
1 -
Language Models
1 -
LlamaIndex
1 -
LLM
2 -
LLMs
2 -
Machine Learning
1 -
Machine learning using SAP HANA
1 -
Mistral AI
1 -
NLP (Natural Language Processing)
1 -
open source
1 -
OpenAI
1 -
Python
2 -
RAG
2 -
Retrieval Augmented Generation
1 -
SAP Build Process Automation
1 -
SAP HANA
1 -
SAP HANA Cloud
1 -
User Experience
1 -
user interface
1 -
Vector Database
3 -
Vector DB
1 -
Vector Similarity
1
Top kudoed authors
| User | Count |
|---|---|
| 4 | |
| 4 | |
| 3 | |
| 3 | |
| 2 | |
| 1 | |
| 1 |