
- SAP Community
- Products and Technology
- Technology
- Technology Blogs by SAP
- What’s New in SAP BusinessObjects Cloud and SAP Di...
Technology Blogs by SAP
Learn how to extend and personalize SAP applications. Follow the SAP technology blog for insights into SAP BTP, ABAP, SAP Analytics Cloud, SAP HANA, and more.
Turn on suggestions
Auto-suggest helps you quickly narrow down your search results by suggesting possible matches as you type.
Showing results for
cchoy
Participant
Options
- Subscribe to RSS Feed
- Mark as New
- Mark as Read
- Bookmark
- Subscribe
- Printer Friendly Page
- Report Inappropriate Content
02-23-2017
7:19 AM
This blog covers some of the latest new features and enhancements in SAP BusinessObjects Cloud and SAP Digital Boardroom release 2017.01.
Note: SAP BusinessObjects Cloud agent must be upgraded to 1.0.43 in conjunction with the SAP BusinessObjects Cloud upgrade to 2017.01.0.
Don’t miss our March 16 #askSAP Analytics Community Call:
SAP Strategy and Roadmap for Cloud and Hybrid Analytics Scenarios
Join us on March 16 to learn more about the SAP Analytics and SAP BusinessObjects Cloud strategy, new enhanced features and functionality, in addition to innovative ideas and capabilities to leverage on-premise SAP investments. Register here >
Highlights of this release include:
You can now set read and write access for dimensions by teams in addition to by individuals.
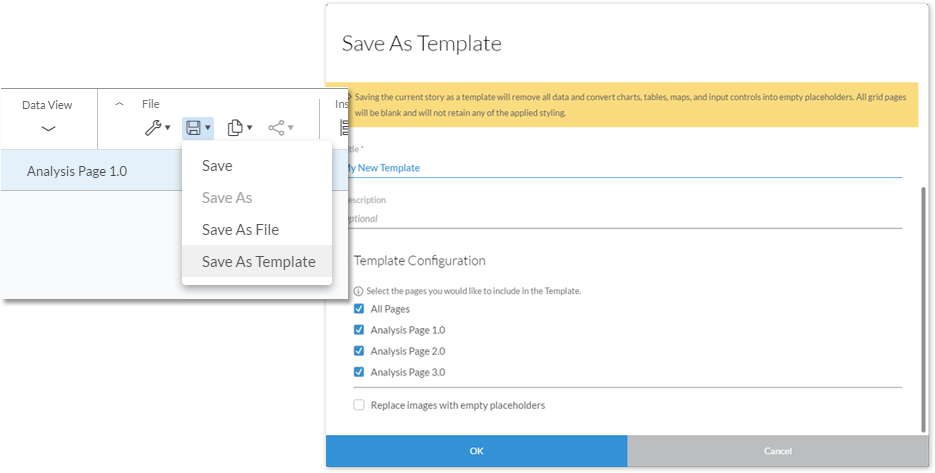
Here’s a new time-saving feature we’re certain you’ve been waiting for. Stories can now be saved and shared as a template for new stories! You can give your template a unique name and description, select specific pages to be included, and choose to replace images with empty placeholders or keep them as part of the template (which can be useful if you are using a corporate logo, for example).
Video tutorial: How to save a story as a template
Please note that saving a story as a template will:
Now when you create a new color palette from scratch or based on an existing palette, you have the option to edit the palette later and apply the changes in your story. You also have the ability to make changes to an existing palette and save it as a copy instead of saving it back to the original palette. All of these options are available in the Builder panel for individual tile styling as well as in the Story Preferences dialog for story-wide styling.

In release 2016.24, we introduced a feature that allows you to set specific dimensions for a measure to be required, and this was enabled for remote HANA views. Now, we have added support for this feature to be also used for SAP BusinessObjects Cloud models.

Previously, you could set story-wide formatting options as the default for all new pages and tiles created. To save you the time of going back and manually updating any pages and tiles created before you set these story-wide preferences, you can now apply these default preferences settings to existing pages and tiles in your story.
But we didn’t just stop there – you’ll find a few more improvements in the Story preferences dialog:

We’ve made a couple of improvements to Marimekko charts that will help make them more visually meaningful.


In the Explorer, you can now sort hierarchical dimensions by measure. You can sort by highest to lowest or vice versa and apply that at each level, and siblings in the tree are sorted relative to each other. Switching between hierarchies does not change the selected sort option.

As you work with a dimension hierarchy, you now have the ability to cascade any changes in format and styling down the hierarchy so that they can be applied to across your tables. These changes also apply when you add or remove members, so that your formatting is are maintained. Please note that data access control selections and filters may influence the appearance of members in your tables.
The Bubble layer now uses spatial clustering (K-means) for handling large amounts of data. This significantly improves performance for loading large data and visualizations, and is enabled by default. You can customize the cluster bubble colors and opacities.

BI users can now run a time-series forecast on a time series trend chart.

In SAP BusinessObjects Cloud, it just takes moments to build a chart that shows you, for example, deal values by country. But what are the key influencers behind the data? Are there any significant findings you should be aware of? Now at the click of a button, you can launch a machine discovery directly from within a story as you build a visualization or a table.


Previously, data could not be entered in unbooked cells when the Set to Invisible option was applied to one or more members in a filter. Now, you can now enter data on unbooked cells in a table with invisible members. These invisible members can even receive values from automatic spreading when data is booked to a parent member.
This is a handy feature when you consider the following scenario. Let’s say for example that you have one person responsible for the status of employees, and she enters ‘1’ as a flag to indicate those that are full time under “Full time employee” – in this case, Harry and Lea.

Another person is responsible for entering salary values, but you want to create a table for this person that allows data entry for full time employees only. You would then include Full time employee in the filter but set its visibility filter to make it invisible. Your table now shows Harry and Lea only, but does not expose the row full time status. With this enhancement, you can now enter data for these unbooked cells.

Note: SAP BusinessObjects Cloud agent must be upgraded to 1.0.43 in conjunction with the SAP BusinessObjects Cloud upgrade to 2017.01.0.
Don’t miss our March 16 #askSAP Analytics Community Call:
SAP Strategy and Roadmap for Cloud and Hybrid Analytics Scenarios
Join us on March 16 to learn more about the SAP Analytics and SAP BusinessObjects Cloud strategy, new enhanced features and functionality, in addition to innovative ideas and capabilities to leverage on-premise SAP investments. Register here >
Highlights of this release include:
- Models: Set read/write permissions for dimensions by teams
- Save a story as a template
- Color palettes: Edit, delete, or save a copy
- Required dimensions for measures: Support for SAP BusinessObjects Cloud models
- Improved story-wide preferences
- Marimekko chart improvements
- Sort measures in the Explorer facet panel
- Cascade format and style changes down hierarchies
- Location Analytics: Support for spatial clustering (K-means)
- Forecasting using time series trend charts for BI users
- Launch a machine discovery as you build a visualization or table
- Value Driver Trees: Data entry in the Digital Boardroom
- Value Driver Trees: Aggregate data for Simple Calculation node
- Allocations: Data entry on unbooked cells with invisible members
- Planning: Edit public versions from within asymmetric reports
Core: Models
Set read/write permissions for dimensions by teams
You can now set read and write access for dimensions by teams in addition to by individuals.
Core: Data Analysis, Stories, and Tables
Save a story as a template
Here’s a new time-saving feature we’re certain you’ve been waiting for. Stories can now be saved and shared as a template for new stories! You can give your template a unique name and description, select specific pages to be included, and choose to replace images with empty placeholders or keep them as part of the template (which can be useful if you are using a corporate logo, for example).
Video tutorial: How to save a story as a template
Please note that saving a story as a template will:
- Remove all grid pages
- Remove all data and convert your widgets into placeholders
- Remove any custom formatting for specific widgets; formatting for new stories based on the template will be based on the story preferences
Color palettes: Edit, delete, or save a copy
Now when you create a new color palette from scratch or based on an existing palette, you have the option to edit the palette later and apply the changes in your story. You also have the ability to make changes to an existing palette and save it as a copy instead of saving it back to the original palette. All of these options are available in the Builder panel for individual tile styling as well as in the Story Preferences dialog for story-wide styling.
Required dimensions for measures: Support for SAP BusinessObjects Cloud models
In release 2016.24, we introduced a feature that allows you to set specific dimensions for a measure to be required, and this was enabled for remote HANA views. Now, we have added support for this feature to be also used for SAP BusinessObjects Cloud models.
- Required dimensions for measures can be enabled for tables, charts, and geo maps.
- Video tutorial: Create and work with required dimensions
Improved story-wide preferences
Previously, you could set story-wide formatting options as the default for all new pages and tiles created. To save you the time of going back and manually updating any pages and tiles created before you set these story-wide preferences, you can now apply these default preferences settings to existing pages and tiles in your story.
But we didn’t just stop there – you’ll find a few more improvements in the Story preferences dialog:
- New options under Tile Settings for more granular control over the styling of your story tiles
- New “Apply to” options allow you to apply your story-wide preferences to all pages and tiles (including existing ones), or only to new pages and tiles
- Waterfall color palette is now editable, as is the default color for axis lines
Marimekko chart improvements
We’ve made a couple of improvements to Marimekko charts that will help make them more visually meaningful.
- The width of the bars in a Marimekko chart used to be controlled by the same measure that you created the chart with. Now, you can specify a different measure to determine the width of the bars. The result? You may see new insights emerge from your data. As you can see in the example below, using discount % instead of sales revenue to set the width allows us to see that not only does Ohio have the lowest sales revenue, but it also has the highest discount %.
- You can now set stacking to 100% for your Marimekko charts, which gives us a different perspective of our data. In this case, it helps us see more clearly the relative distribution of sales revenue by product in each location.
Sort measures in the Explorer facet panel
In the Explorer, you can now sort hierarchical dimensions by measure. You can sort by highest to lowest or vice versa and apply that at each level, and siblings in the tree are sorted relative to each other. Switching between hierarchies does not change the selected sort option.
Cascade format and style changes down hierarchies
As you work with a dimension hierarchy, you now have the ability to cascade any changes in format and styling down the hierarchy so that they can be applied to across your tables. These changes also apply when you add or remove members, so that your formatting is are maintained. Please note that data access control selections and filters may influence the appearance of members in your tables.
- Video tutorial: How to apply formatting to tables
- Learn how to style a table on a grid
- Learn how to style a story tile
- Learn more about hierarchies
Core: Location Analytics
Support for spatial clustering (K-means)
The Bubble layer now uses spatial clustering (K-means) for handling large amounts of data. This significantly improves performance for loading large data and visualizations, and is enabled by default. You can customize the cluster bubble colors and opacities.
- Please note this is not supported for Live HANA connectivity at this time. Also, if you choose to manually turn clustering off, a maximum of 20000 location points are displayed.
- Learn how to create a geo map
- Learn more about analyzing geographical data
Predictive
Forecasting using time series trend charts for BI users
BI users can now run a time-series forecast on a time series trend chart.
Launch a machine discovery as you build a visualization or table
In SAP BusinessObjects Cloud, it just takes moments to build a chart that shows you, for example, deal values by country. But what are the key influencers behind the data? Are there any significant findings you should be aware of? Now at the click of a button, you can launch a machine discovery directly from within a story as you build a visualization or a table.
- Learn more about guided machine discoveries
- Related: Learn how to run a machine discovery
- Related: Learn how to explore your data
Other Predictive enhancements
- Raw data values in discovery results are now formatted as defined in the data source.
Planning
New features for Value Driver Trees
- Data entry in the Digital Boardroom
Now when you are using the Digital Boardroom, there are two ways for you to adjust the data in a value driver tree node. Start by selecting a node, which will bring up a keypad. The first way is to simply enter or adjust your data using the keypad. The second way, which applies only to booked values, is to use the slider above the keypad to change a value by percentage. The equal (=) sign can be used to apply the changes.
- Calculate on aggregate data
For the Simple Calculation node, it is now possible to run the calculation on aggregates instead of calculating on details.
Allocations: Data entry on unbooked cells with invisible members
Previously, data could not be entered in unbooked cells when the Set to Invisible option was applied to one or more members in a filter. Now, you can now enter data on unbooked cells in a table with invisible members. These invisible members can even receive values from automatic spreading when data is booked to a parent member.
This is a handy feature when you consider the following scenario. Let’s say for example that you have one person responsible for the status of employees, and she enters ‘1’ as a flag to indicate those that are full time under “Full time employee” – in this case, Harry and Lea.
Another person is responsible for entering salary values, but you want to create a table for this person that allows data entry for full time employees only. You would then include Full time employee in the filter but set its visibility filter to make it invisible. Your table now shows Harry and Lea only, but does not expose the row full time status. With this enhancement, you can now enter data for these unbooked cells.
Editing public versions
- You can now start editing public versions from within asymmetric reports.
Additional resources:
- Release notes: SAP BusinessObjects Cloud 2017.01
- Video tutorials
- SAP BusinessObjects Help Resources
- Official roadmap contains more info on future plans, subject to change.
Previous feature summary blogs:
- SAP Managed Tags:
- SAP Analytics Cloud
You must be a registered user to add a comment. If you've already registered, sign in. Otherwise, register and sign in.
Labels in this area
-
ABAP CDS Views - CDC (Change Data Capture)
2 -
AI
1 -
Analyze Workload Data
1 -
BTP
1 -
Business and IT Integration
2 -
Business application stu
1 -
Business Technology Platform
1 -
Business Trends
1,658 -
Business Trends
93 -
CAP
1 -
cf
1 -
Cloud Foundry
1 -
Confluent
1 -
Customer COE Basics and Fundamentals
1 -
Customer COE Latest and Greatest
3 -
Customer Data Browser app
1 -
Data Analysis Tool
1 -
data migration
1 -
data transfer
1 -
Datasphere
2 -
Event Information
1,400 -
Event Information
66 -
Expert
1 -
Expert Insights
177 -
Expert Insights
299 -
General
1 -
Google cloud
1 -
Google Next'24
1 -
Kafka
1 -
Life at SAP
780 -
Life at SAP
13 -
Migrate your Data App
1 -
MTA
1 -
Network Performance Analysis
1 -
NodeJS
1 -
PDF
1 -
POC
1 -
Product Updates
4,577 -
Product Updates
344 -
Replication Flow
1 -
RisewithSAP
1 -
SAP BTP
1 -
SAP BTP Cloud Foundry
1 -
SAP Cloud ALM
1 -
SAP Cloud Application Programming Model
1 -
SAP Datasphere
2 -
SAP S4HANA Cloud
1 -
SAP S4HANA Migration Cockpit
1 -
Technology Updates
6,873 -
Technology Updates
423 -
Workload Fluctuations
1
Related Content
- 体验更丝滑!SAP 分析云 2024.07 版功能更新 in Technology Blogs by SAP
- What’s New in SAP Analytics Cloud Release 2024.08 in Technology Blogs by SAP
- What’s New in SAP Analytics Cloud Release 2024.07 in Technology Blogs by SAP
- What’s New in SAP Analytics Cloud Release 2024.06 in Technology Blogs by SAP
- Align Elements In WebI Like My Oven Timer in Technology Blogs by Members
Top kudoed authors
| User | Count |
|---|---|
| 40 | |
| 25 | |
| 17 | |
| 14 | |
| 8 | |
| 7 | |
| 7 | |
| 7 | |
| 6 | |
| 6 |